22 Oct 2024
|11 min
Figma prototype testing
We've implemented a bunch of new features and improvements to Figma prototype testing in Lyssna.

Share on


Share on
In 2021, we launched a new Figma prototype testing feature. This allows you to embed Figma flows directly into the Lyssna test builder and test your prototypes with users to get quick feedback.
Since our initial launch, Figma prototype testing has become our most-used feature here at Lyssna. But we knew we could improve the experience and make it even better.
To kick off our project, we ran a series of qualitative interviews with our customers. Our goal was to validate a set of objectives we’d collated from feedback received over the past nine months.
By doing this, we learnt that we could not only make improvements, we could also expand on this to better cater for the two types of research UX designers are most commonly looking to do when validating their designs.
We’re happy to announce that these new prototype test features and updates are now available! Let’s explore what’s new and improved.
Introducing two new ways to test your Figma prototypes: Task Flow and Free Flow
Based on the user feedback we gathered, we came to understand that customers test prototypes at all stages of the design process.
UX designers don’t just test a high-fidelity prototype before they hand it over to the dev team. They create multiple prototypes at different stages, get ongoing feedback from users, and make iterative improvements to their designs.
So that’s why we created two new ways to test your Figma prototypes – Task Flow and Free Flow.
Here’s a breakdown of what Task Flow and Free Flow does and how to choose between them.
Scenario | Task Flow | Free Flow |
|---|---|---|
How to choose | Choose when you’re confident with your design and want to test a flow with a specific set of objectives that ends with a success/goal screen. | Choose when you’re in an exploratory phase of a project and are looking for initial feedback on your designs. |
When to choose | Choose when you have a specific task you want participants to complete. | Choose when you want participants to discover a flow on their own. |
Use cases | Ease of use: See whether participants can complete a specific task, and see how easily they can complete the task. | - Comprehension: Test whether information is easy to understand. This is especially important when information is progressively revealed, laid out in multiple pages, or revealed through interactive components like hover or a modal. - Navigation: Find out if users can find information by navigating through different screens, and whether they find the navigation intuitive. - Design: Find out what participants think about the design aesthetics. |
As you can see, Task Flow and Free Flow gives you more flexibility when it comes to testing your Figma prototypes depending on your goals and where you’re at in the design process.
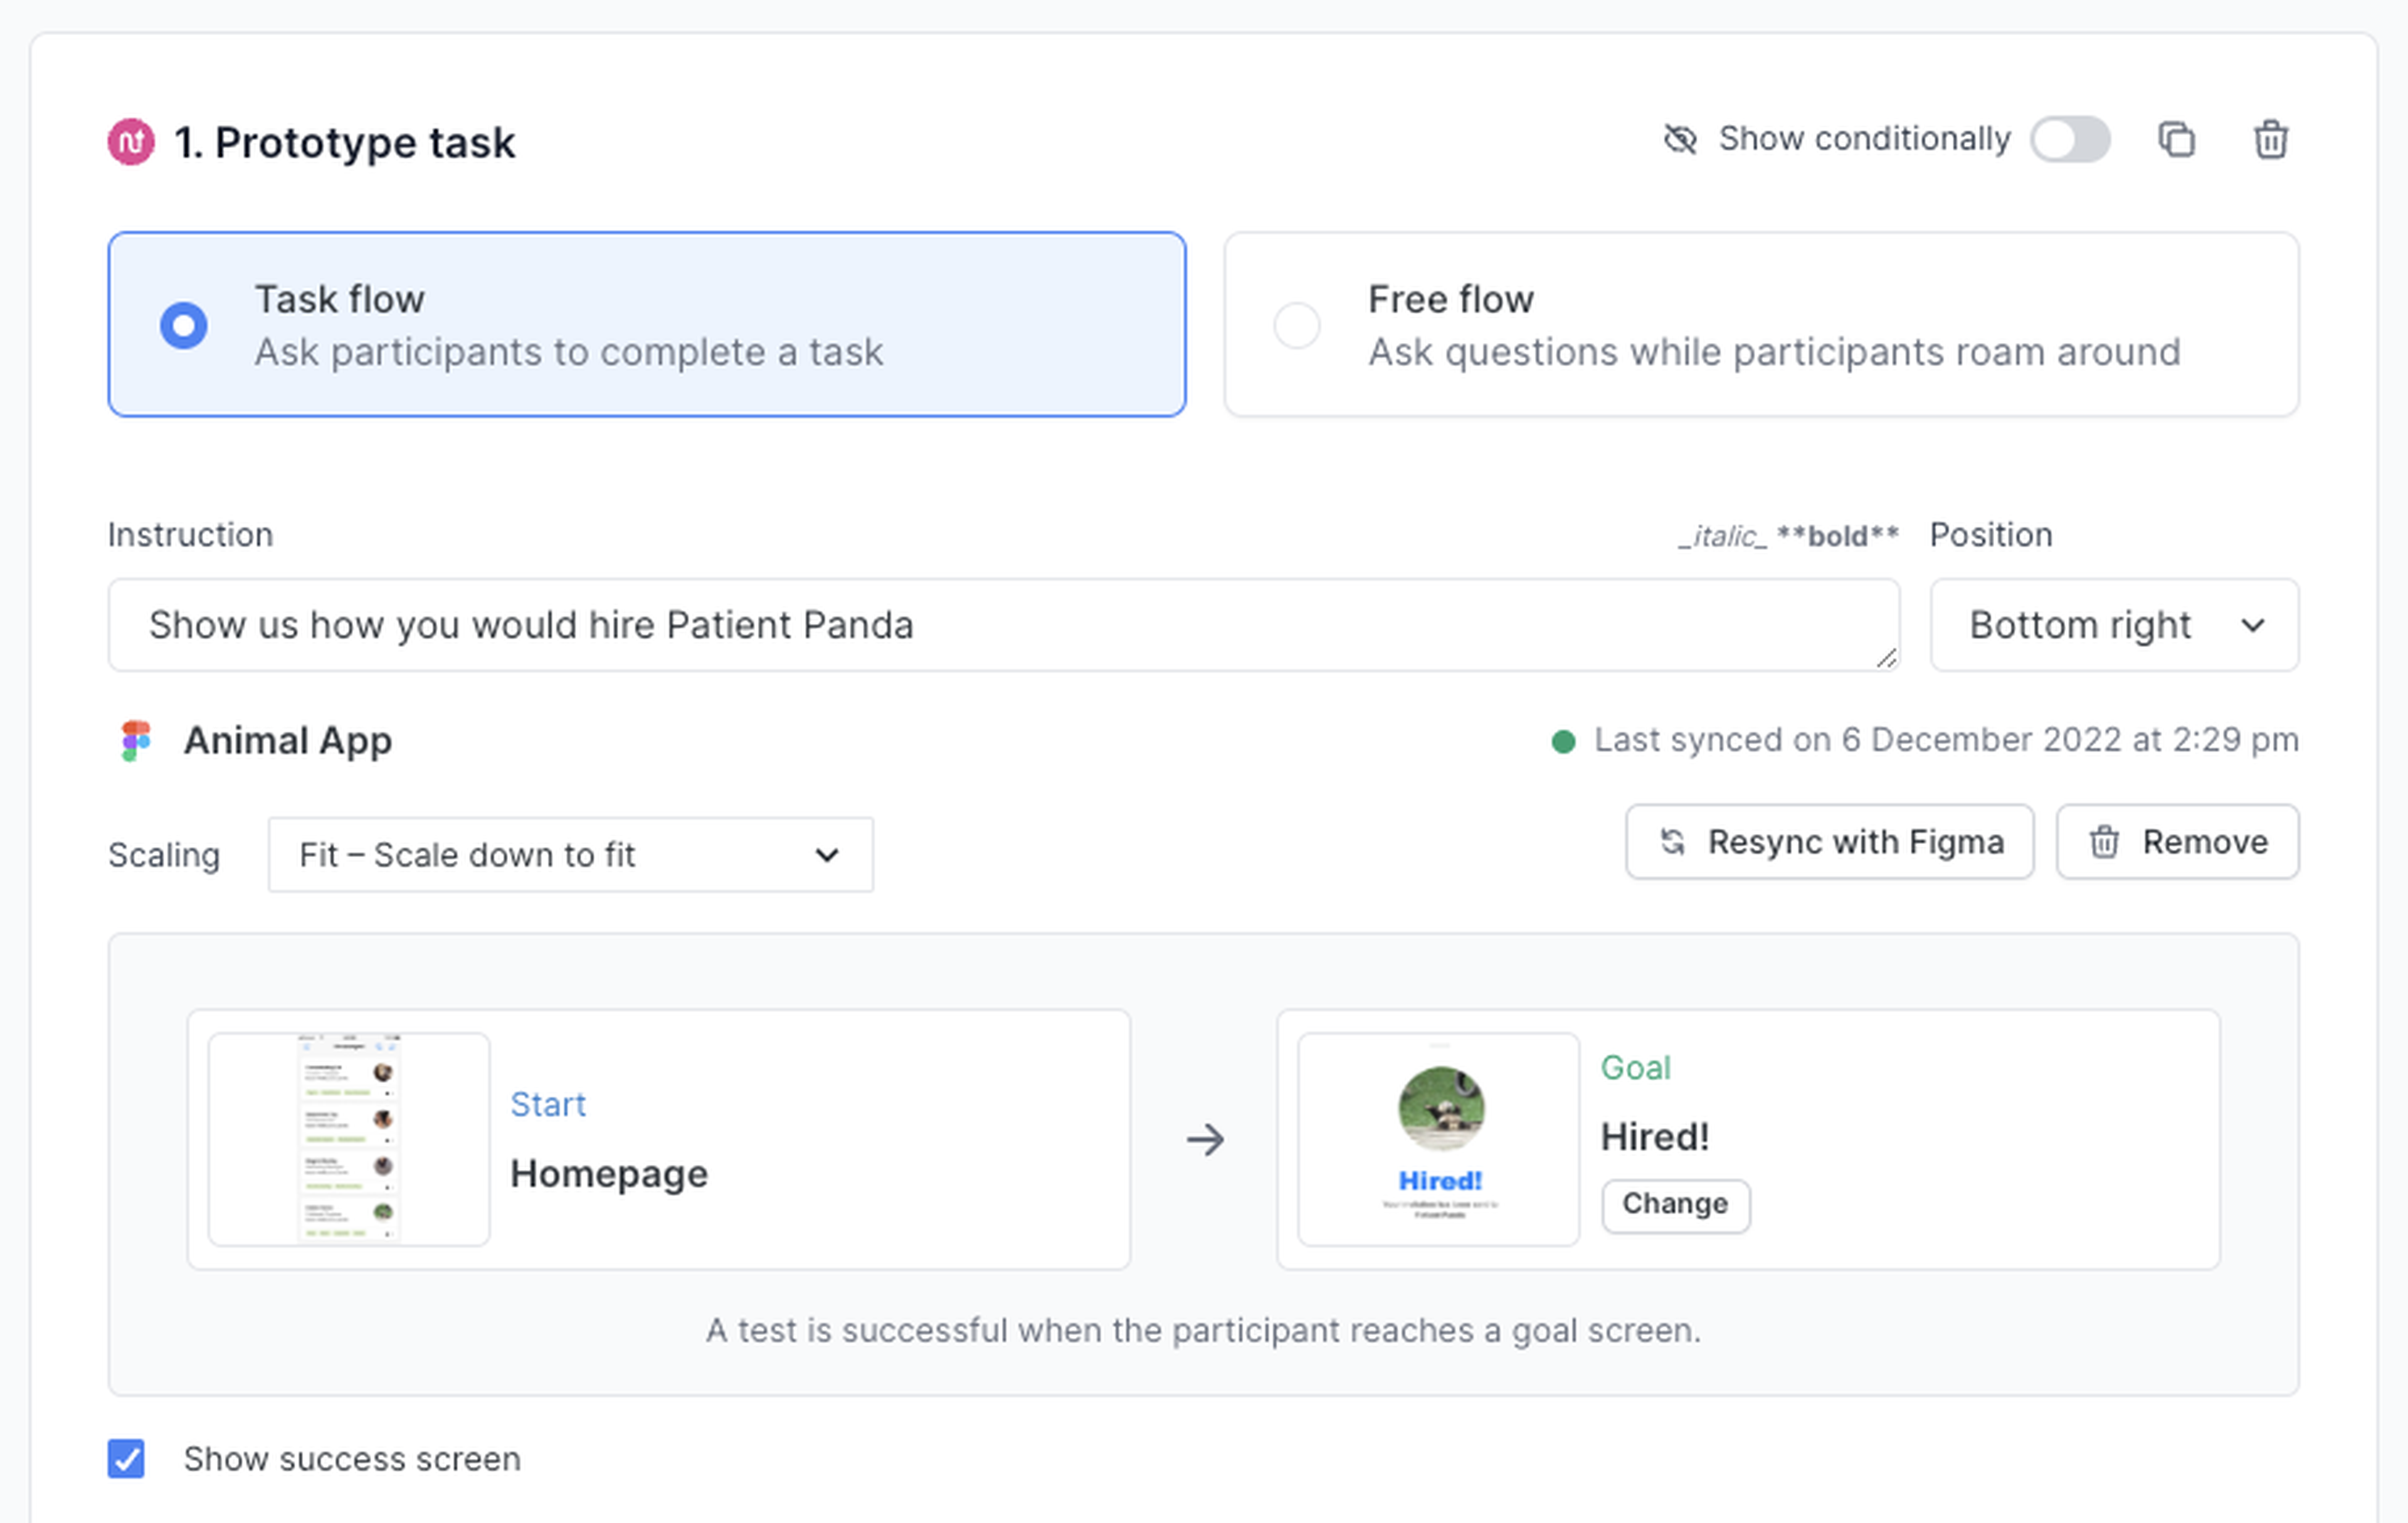
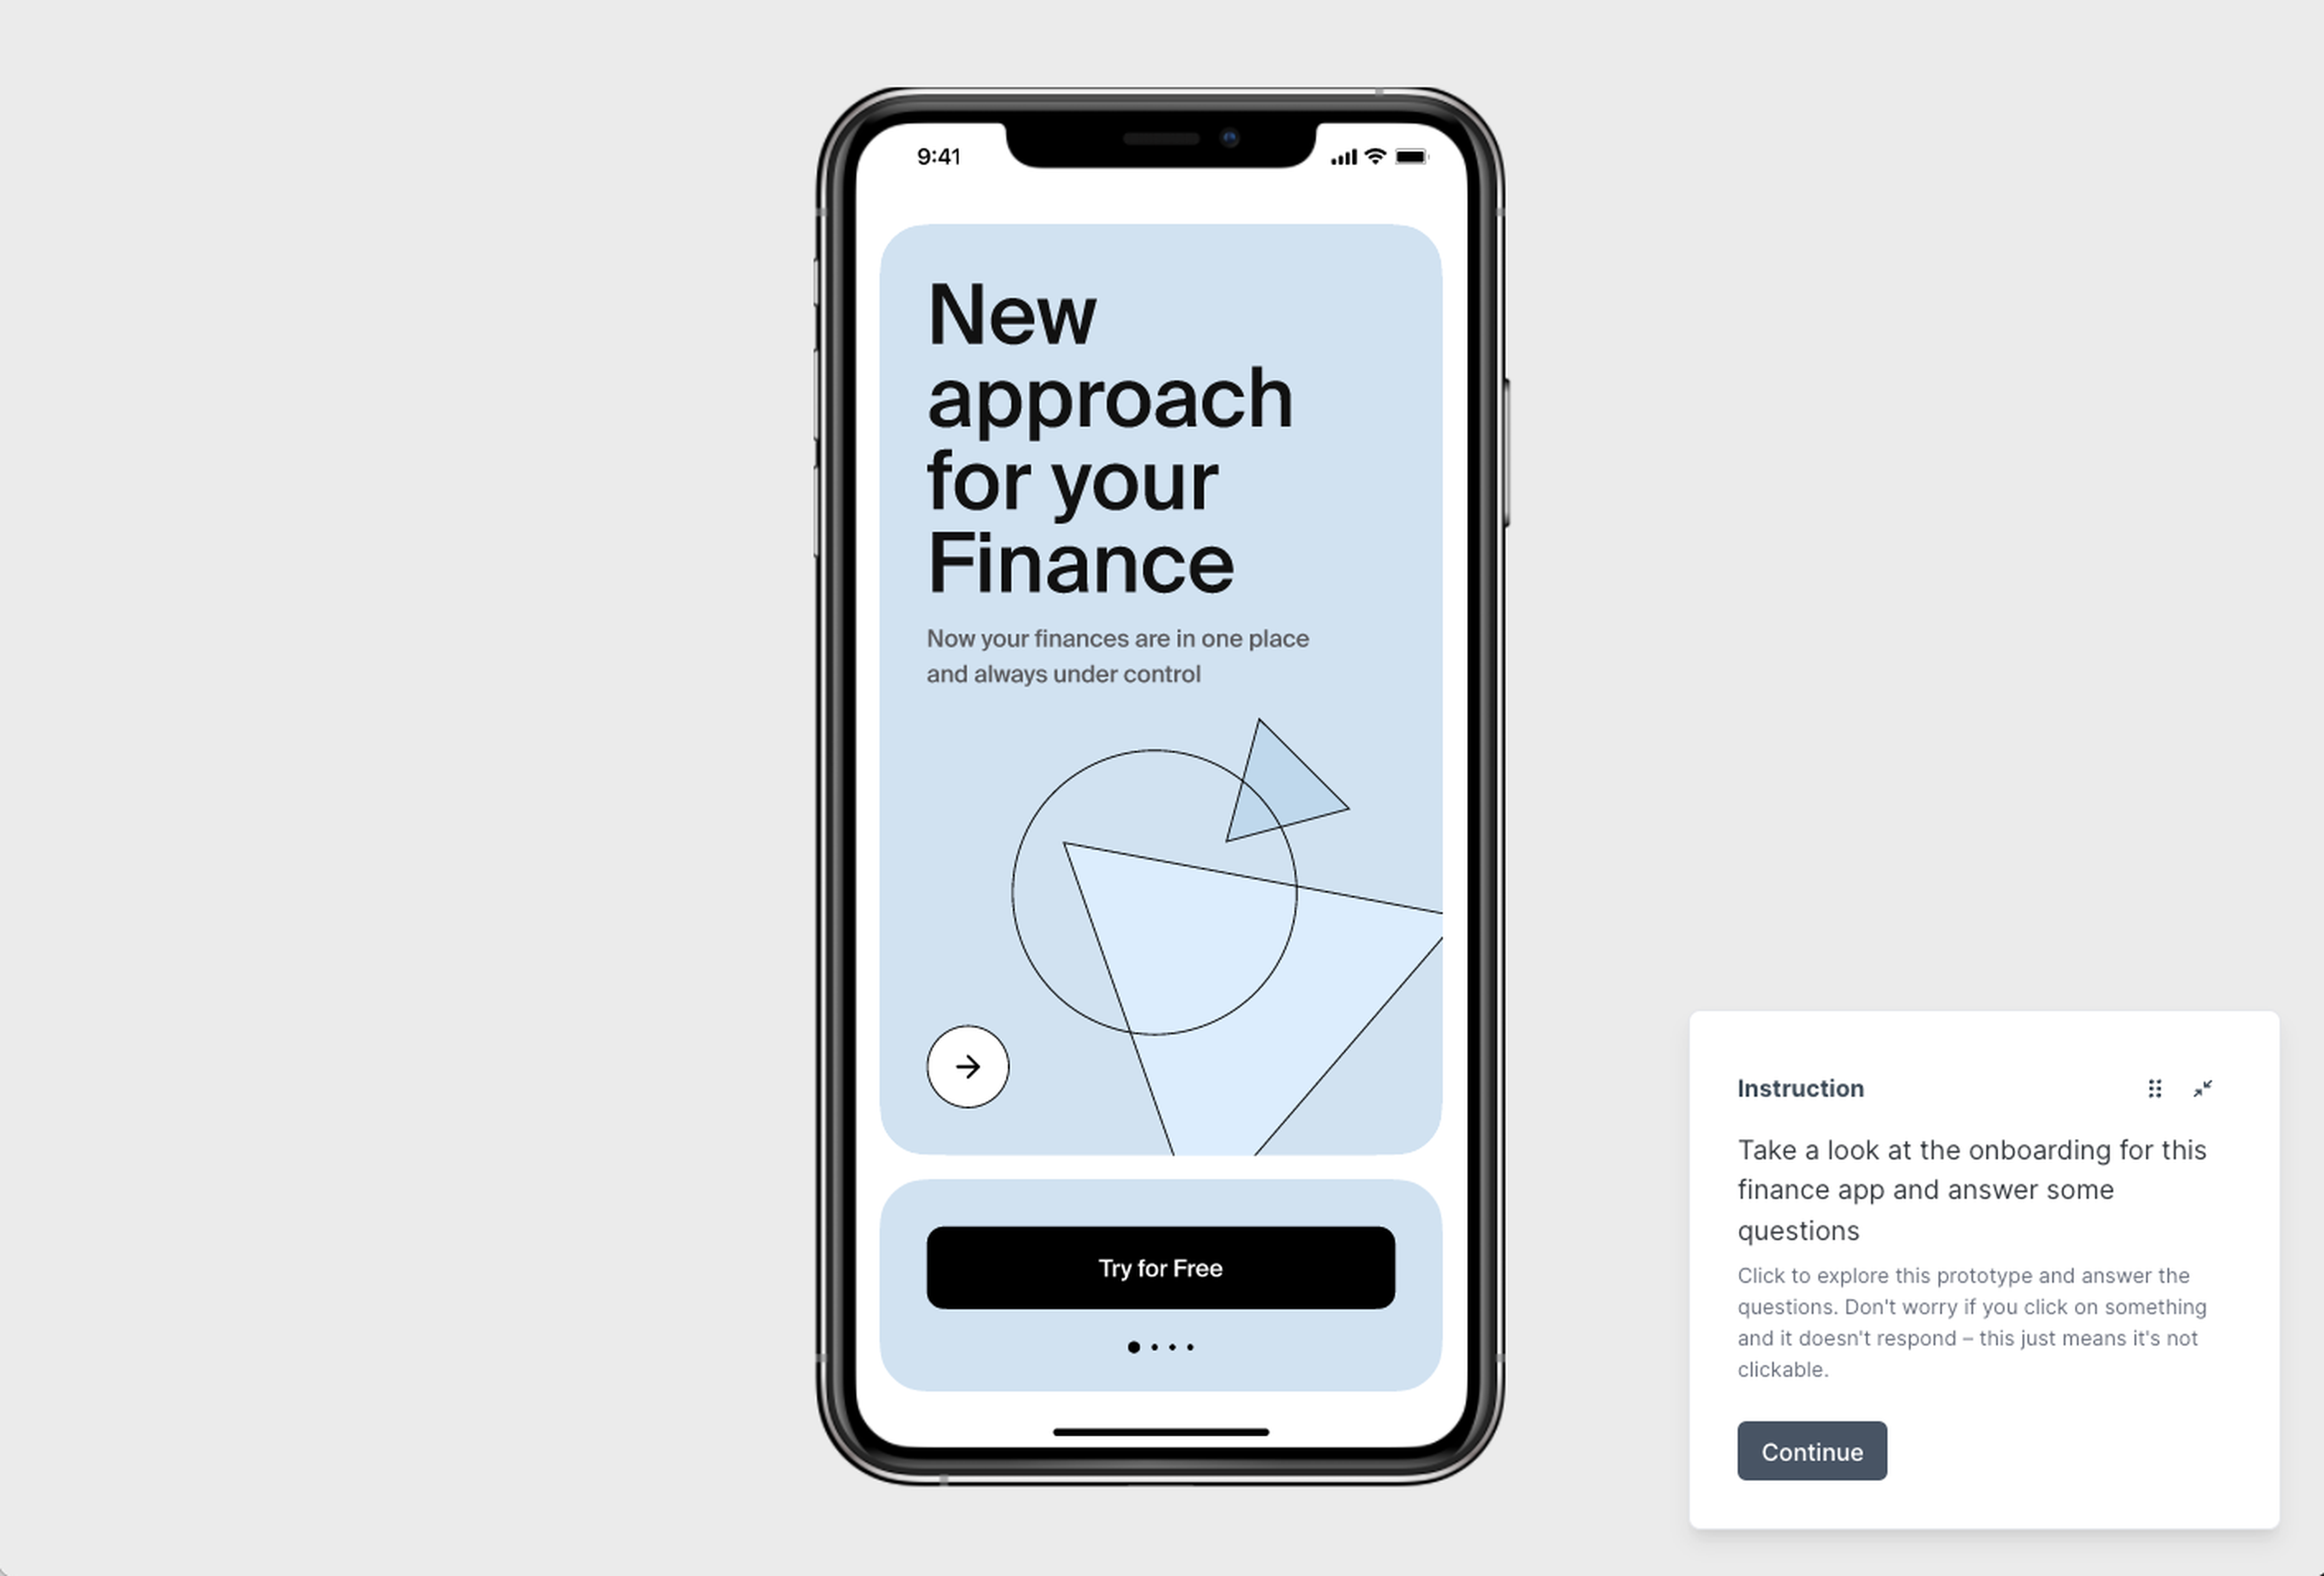
Floating modal – a better way to add instructions and ask follow-up questions
Need to add some guidance or dig a little deeper with your participants? You can add custom instructions and ask follow-up questions with both Task Flow and Free Flow prototype tasks.
Okay, so that might not sound all that special. But what we are excited about is that any custom instructions or follow-up questions you add will now appear in a floating modal within a flow. Participants can move the modal around the screen to each corner of the page, or minimize to hide it temporarily, which means they can always keep the prototype screen in view.
Conditional logic can also apply to follow-up questions. This allows you to ask a question based on whether or not a participant completed a task.
As with all of our tests, you can also add additional test sections for a user to complete after they’ve finished the prototype test, like a survey or a preference test.
Start testing your Figma prototypes today
Ready to get actionable feedback on your Figma prototypes? Sign up to a free Lyssna plan and start running prototype tests in minutes. No credit card required.

New ways to view prototype test results
We’ve also made improvements to the Figma prototype testing results page. Below is a breakdown of the metrics you’ll see for both Task Flow and Free Flow prototype tests.
Task Flow
Screen thumbnails:
Average time spent and total number of clicks per screen.
Titles for each screen.
A green label signifies the goal screen.
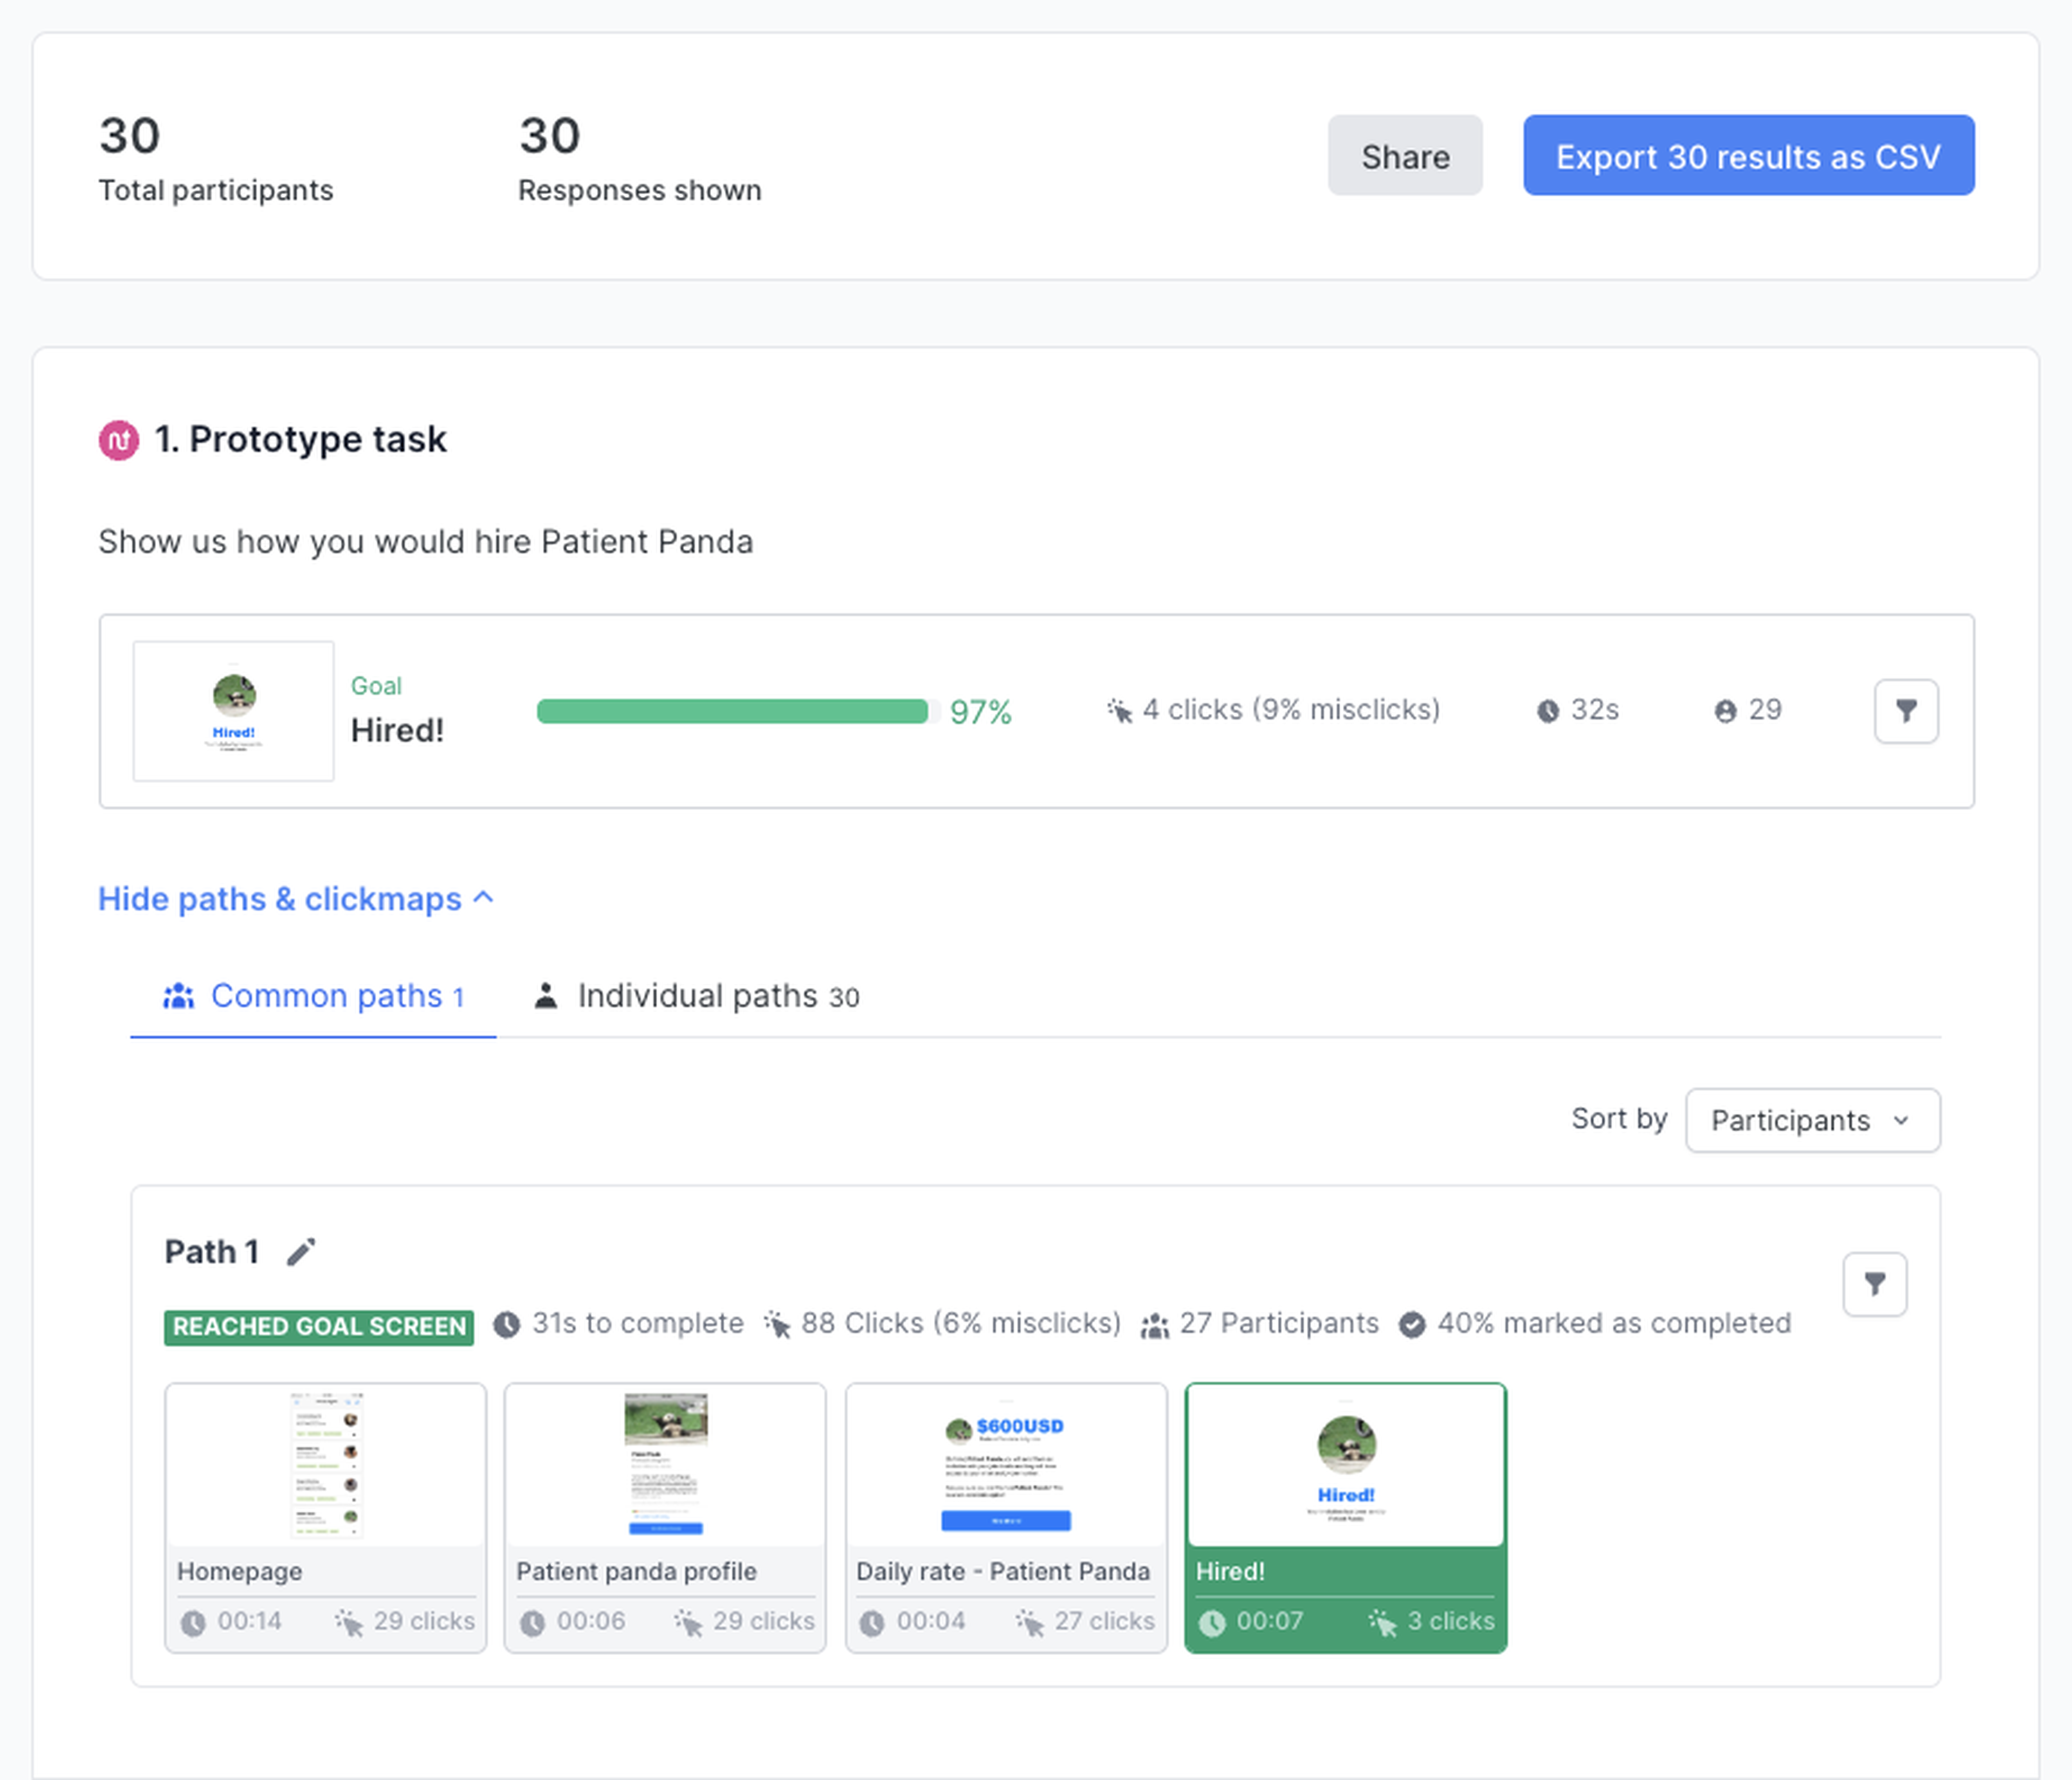
Image overview:
View the original image or view it as a heat map or click map.
The average time participants spent completing the task, the total number of clicks per screen, and the percentage of misclicks (clicks outside a hotspot). Filter to show specific clicks, e.g. first clicks, second clicks, and so on.
Zoom in to expand the image.
Results overview:
The percentage of participants who reached the goal screen.
The percentage of misclicks.
The percentage of participants who marked the task as complete.
The percentage of participants who gave up on the task.
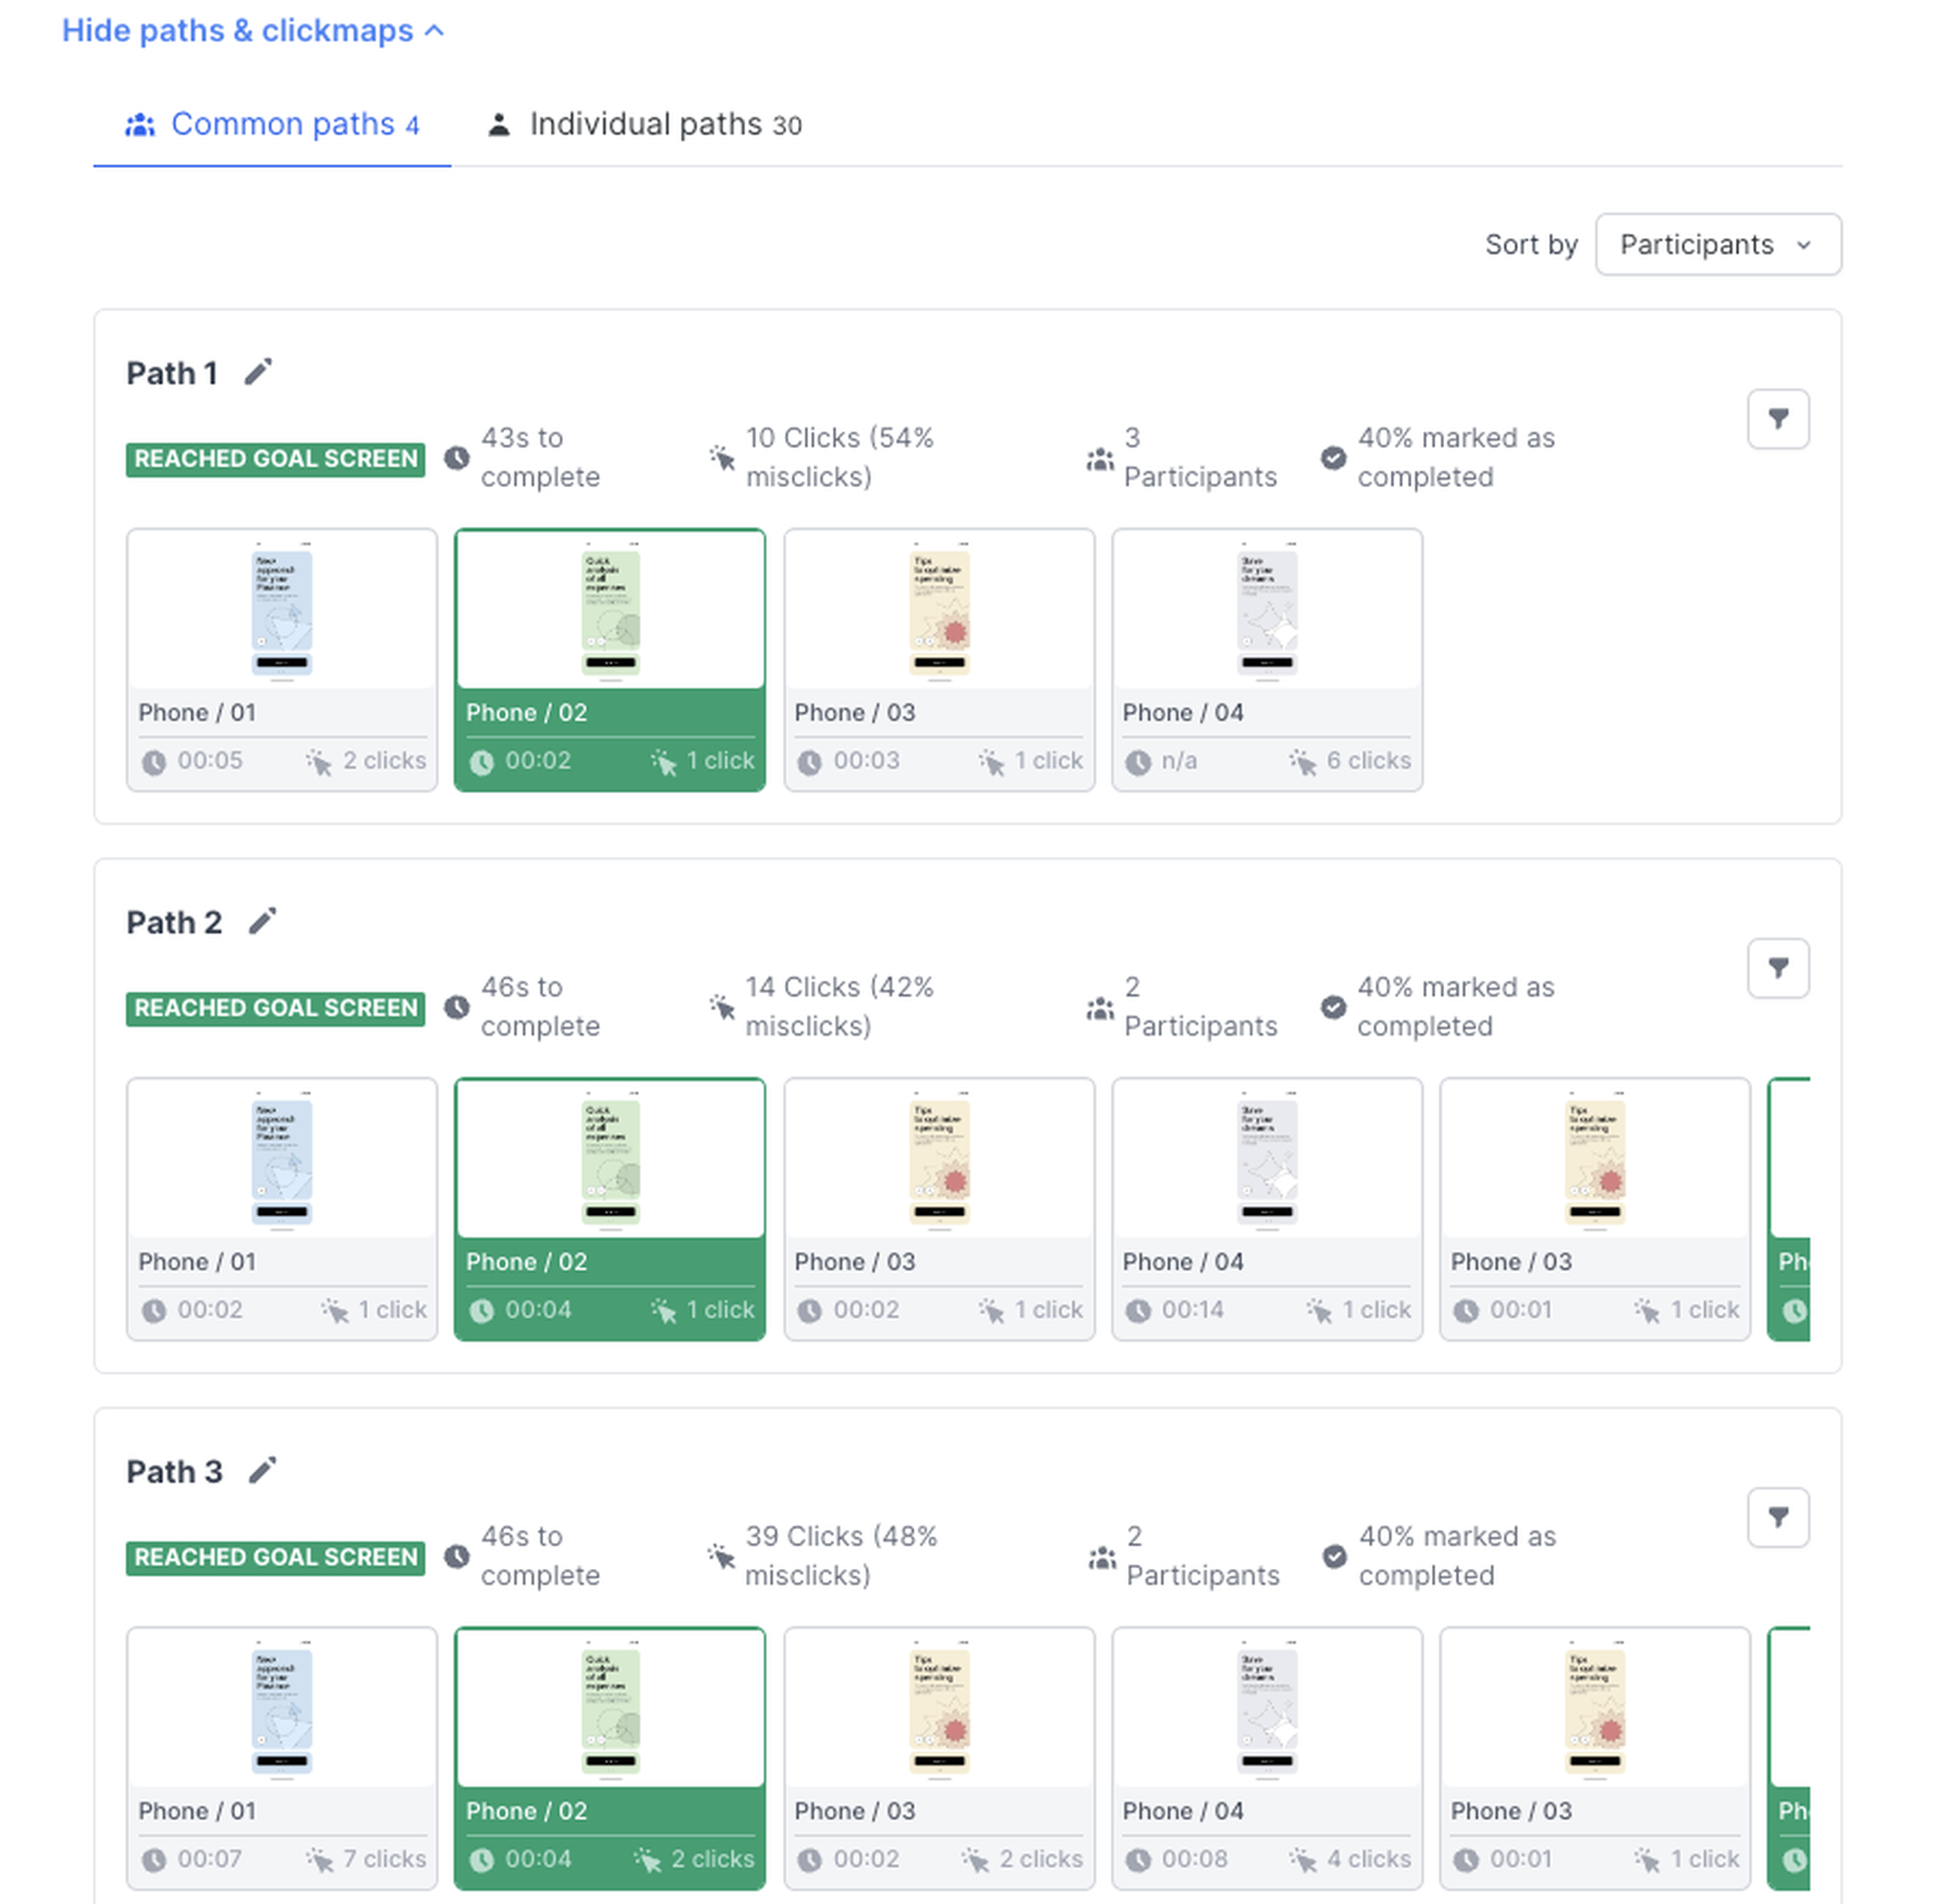
Common paths:
View a summary of the time it took participants to complete the path, along with the number of clicks, the percentage of misclicks, the number of participants who completed the goal, and the number of participants who didn’t reach the goal.
Drill down to the individual screen view to see the average time spent on each screen, the total number of clicks, and the percentage of misclicks.
View individual screens as a heat map and a click map, and download these images.
Filter common paths to see participant demographics in the left-hand panel, plus any other questions they answered in a test.
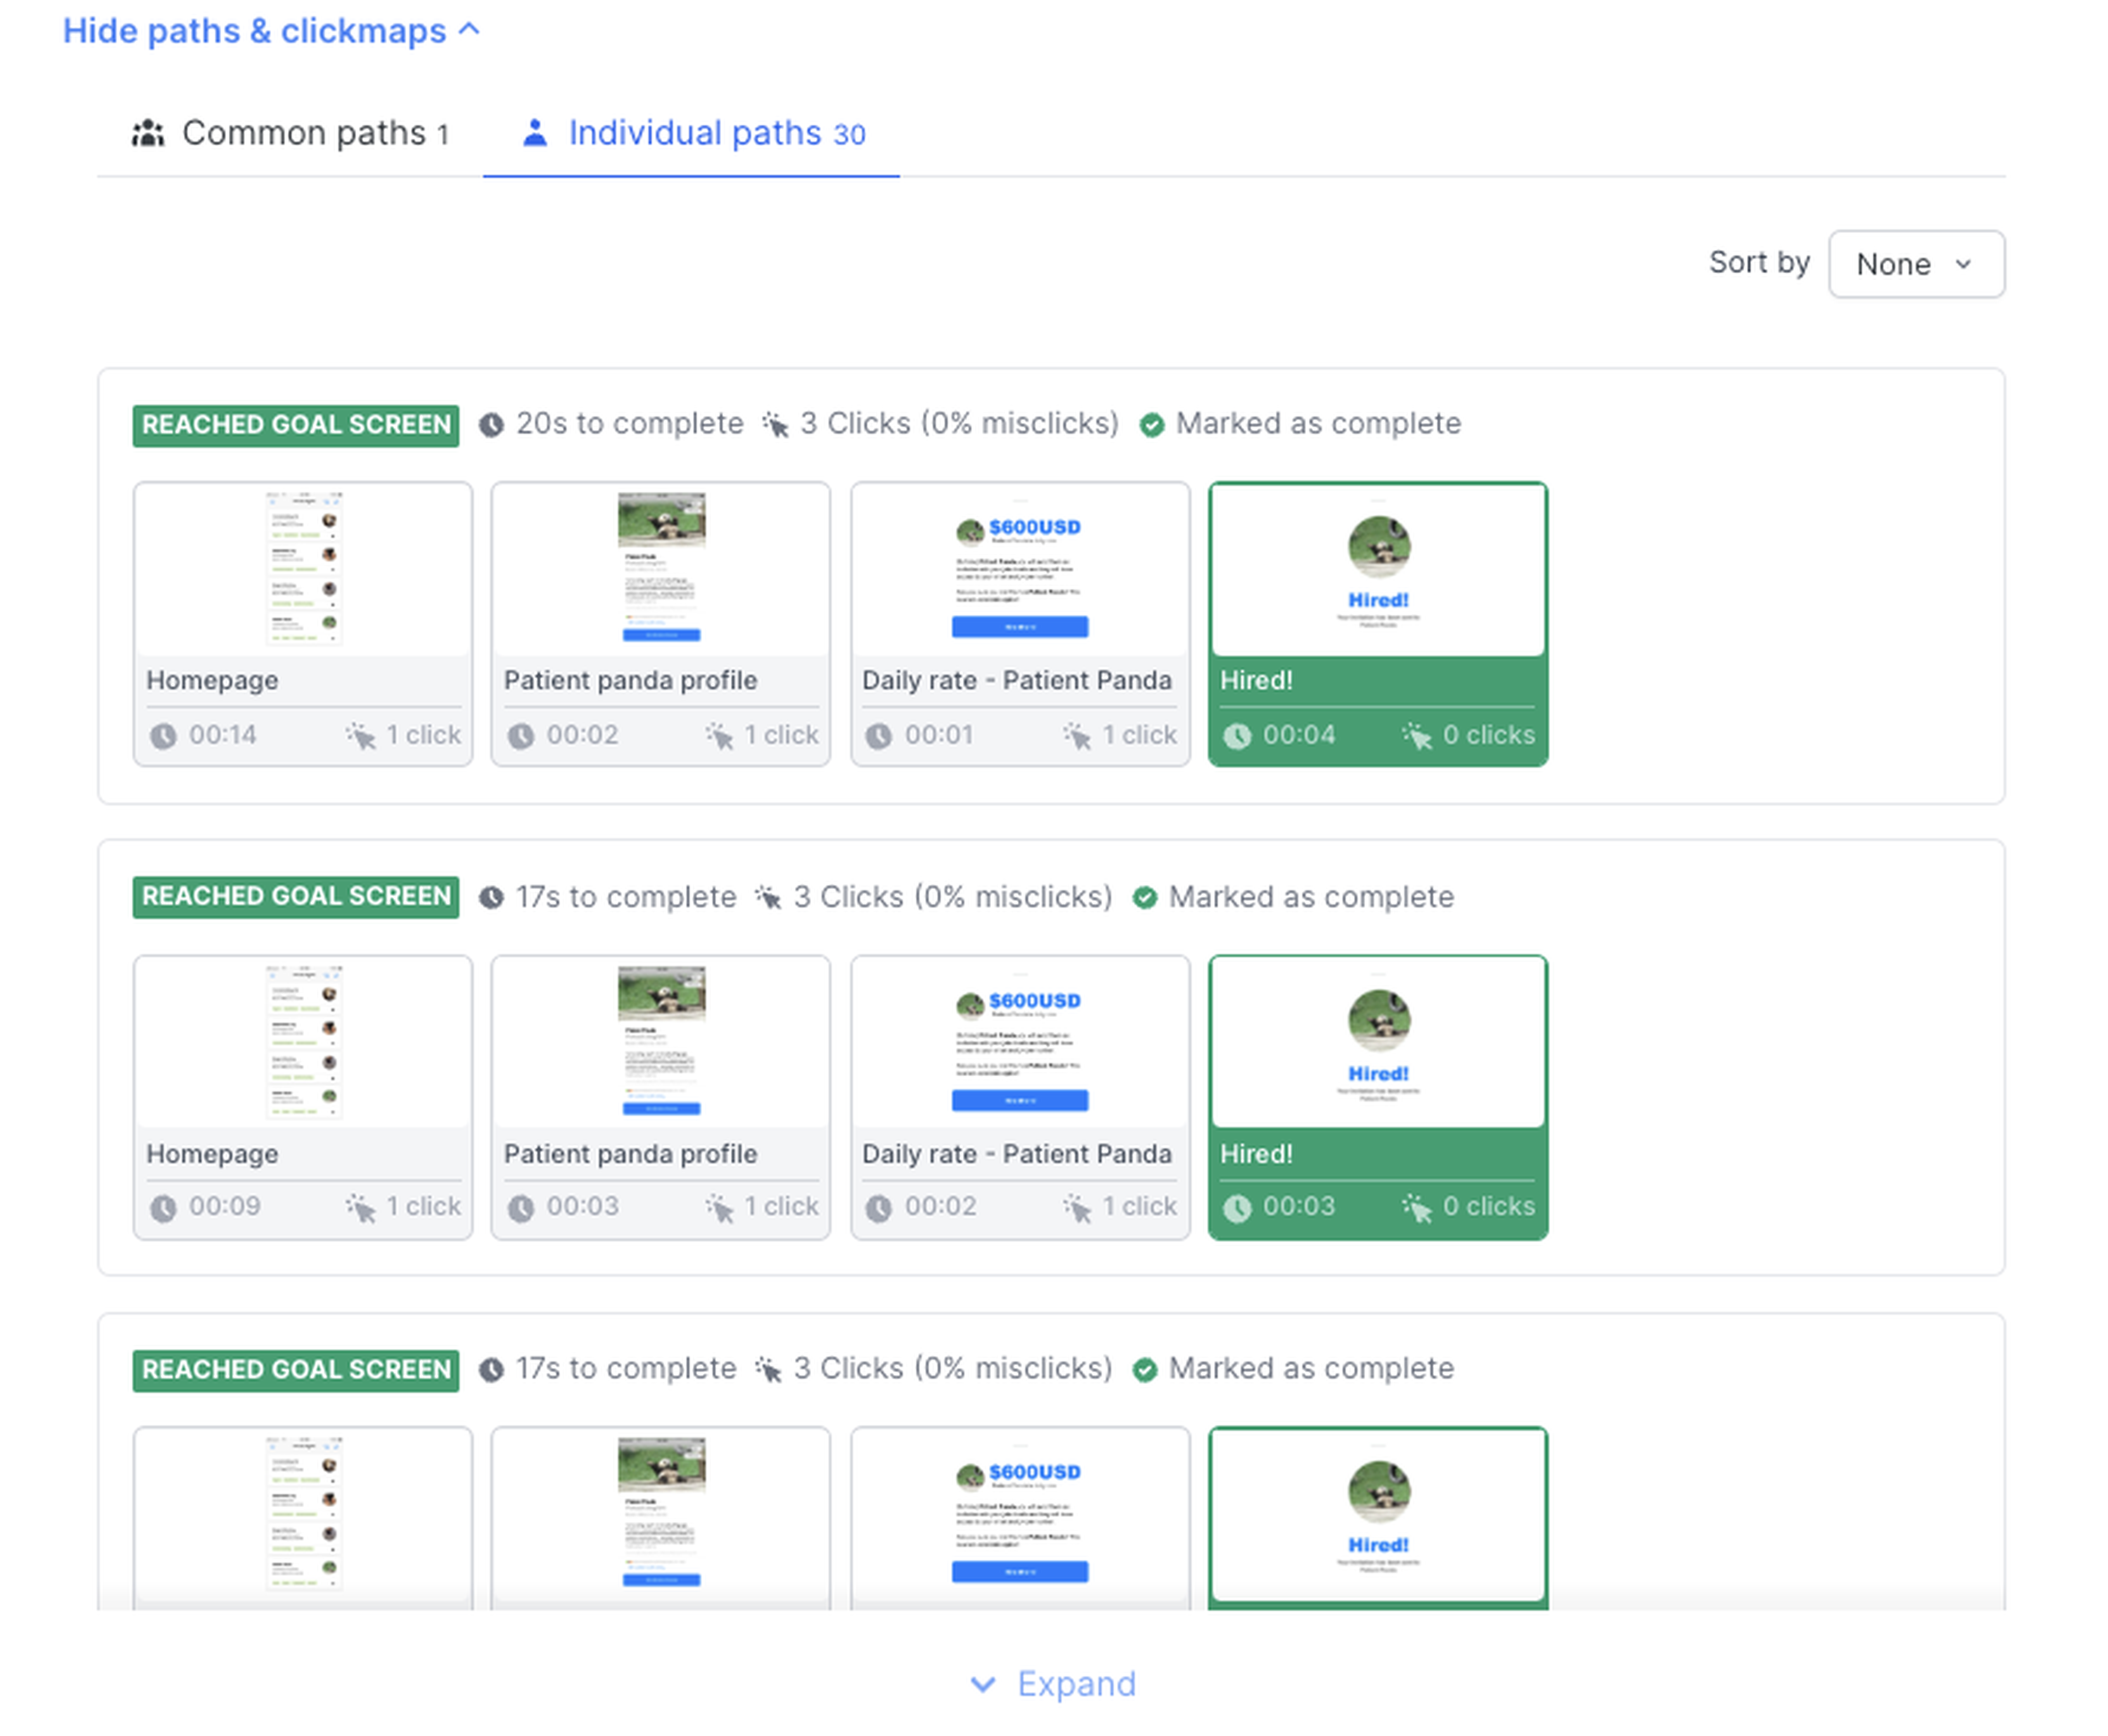
Individual paths:
A green “Reached goal screen” label is displayed for individual results.
Hover over an individual path and click on the person icon to view a participant’s demographic information. You can also delete their response.
View a summary of the time it took each participant to complete the flow, along with the number of clicks, the percentage of misclicks, and whether the participant marked the task as complete.
As with common paths, you can also drill down to an individual path screen view to see the average time the participant spent on that screen, the total number of clicks, and the percentage of misclicks.
As with common paths, you can view these screens as a heat map and click map, and download these images.
Get started quickly with our Task Flow prototype tests:
Free Flow
Thumbnails:
Average time on screen.
Number of clicks per screen.
Title of each screen.
A gray label identifies the start screen.
The ability to set a goal screen.
Image overview:
View the original image or view as a heat map or click map. You can also zoom in to expand the image.
Average time spent on each screen.
Total number of clicks per screen and percentage of misclicks. Filter to show specific clicks, e.g. first clicks, second clicks, and so on.
Results overview:
Select a screen to view the total number of participants and the percentage of participants who interacted with that screen.
Ability to label a goal screen.
Average time spent on screen.
Number of total clicks.
Percentage of misclicks.
Common paths:
The ability to rename the title of a path.
View a summary of the time it took participants to complete the path, along with the number of clicks, the percentage of misclicks, the number of participants that completed the path, and the number of participants that gave up on the task.
Drill down to the individual screen view to see the average time spent on that screen, the total number of clicks, and the percentage of misclicks. Filter to show specific clicks, e.g. first clicks, second clicks, and so on.
You can also view individual screens with the original image, or as a heat map or a click map, and download these images.
Filter common paths to see participant demographics in the left-hand panel, plus any other questions they answered in a test.
Individual paths:
Summary of the time it took each participant to complete the flow, along with the number of clicks, the percentage of misclicks, and whether the participant marked the task as complete.
Hover over an individual path and click on the person icon to view a participant’s demographic information. You can also delete their response.
As with common paths, you can also drill down to an individual path screen view to see the average time the participant spent on that screen, the total number of clicks, and the percentage of misclicks.
As with common paths, you can view these screens as a heat map and click map, and download these images.
Get started quickly with our Free Flow prototype test template.
What other improvements have we made?
Besides building the Task Flow and Free Flow prototype tests, we’ve made a bunch of other improvements to the way you can test Figma prototypes in Lyssna.
Here’s a summary of all the updates.
Instructions: A floating modal displaying the test instructions is shown to participants. This means they can always see the instructions, but can move them around so they don’t get in the way of the prototype screens.
Results page: We went into detail above about the results pages, but we made some other improvements, like:
The screen carousel is now displayed as a grid for both Task Flow and Free Flow tests.
You can now edit the name of common paths.
The titles you assign for each screen are displayed.
The goal screen is highlighted.
You can filter the sequencing of the order of clicks.
We now display the average total time participants spend on each screen.
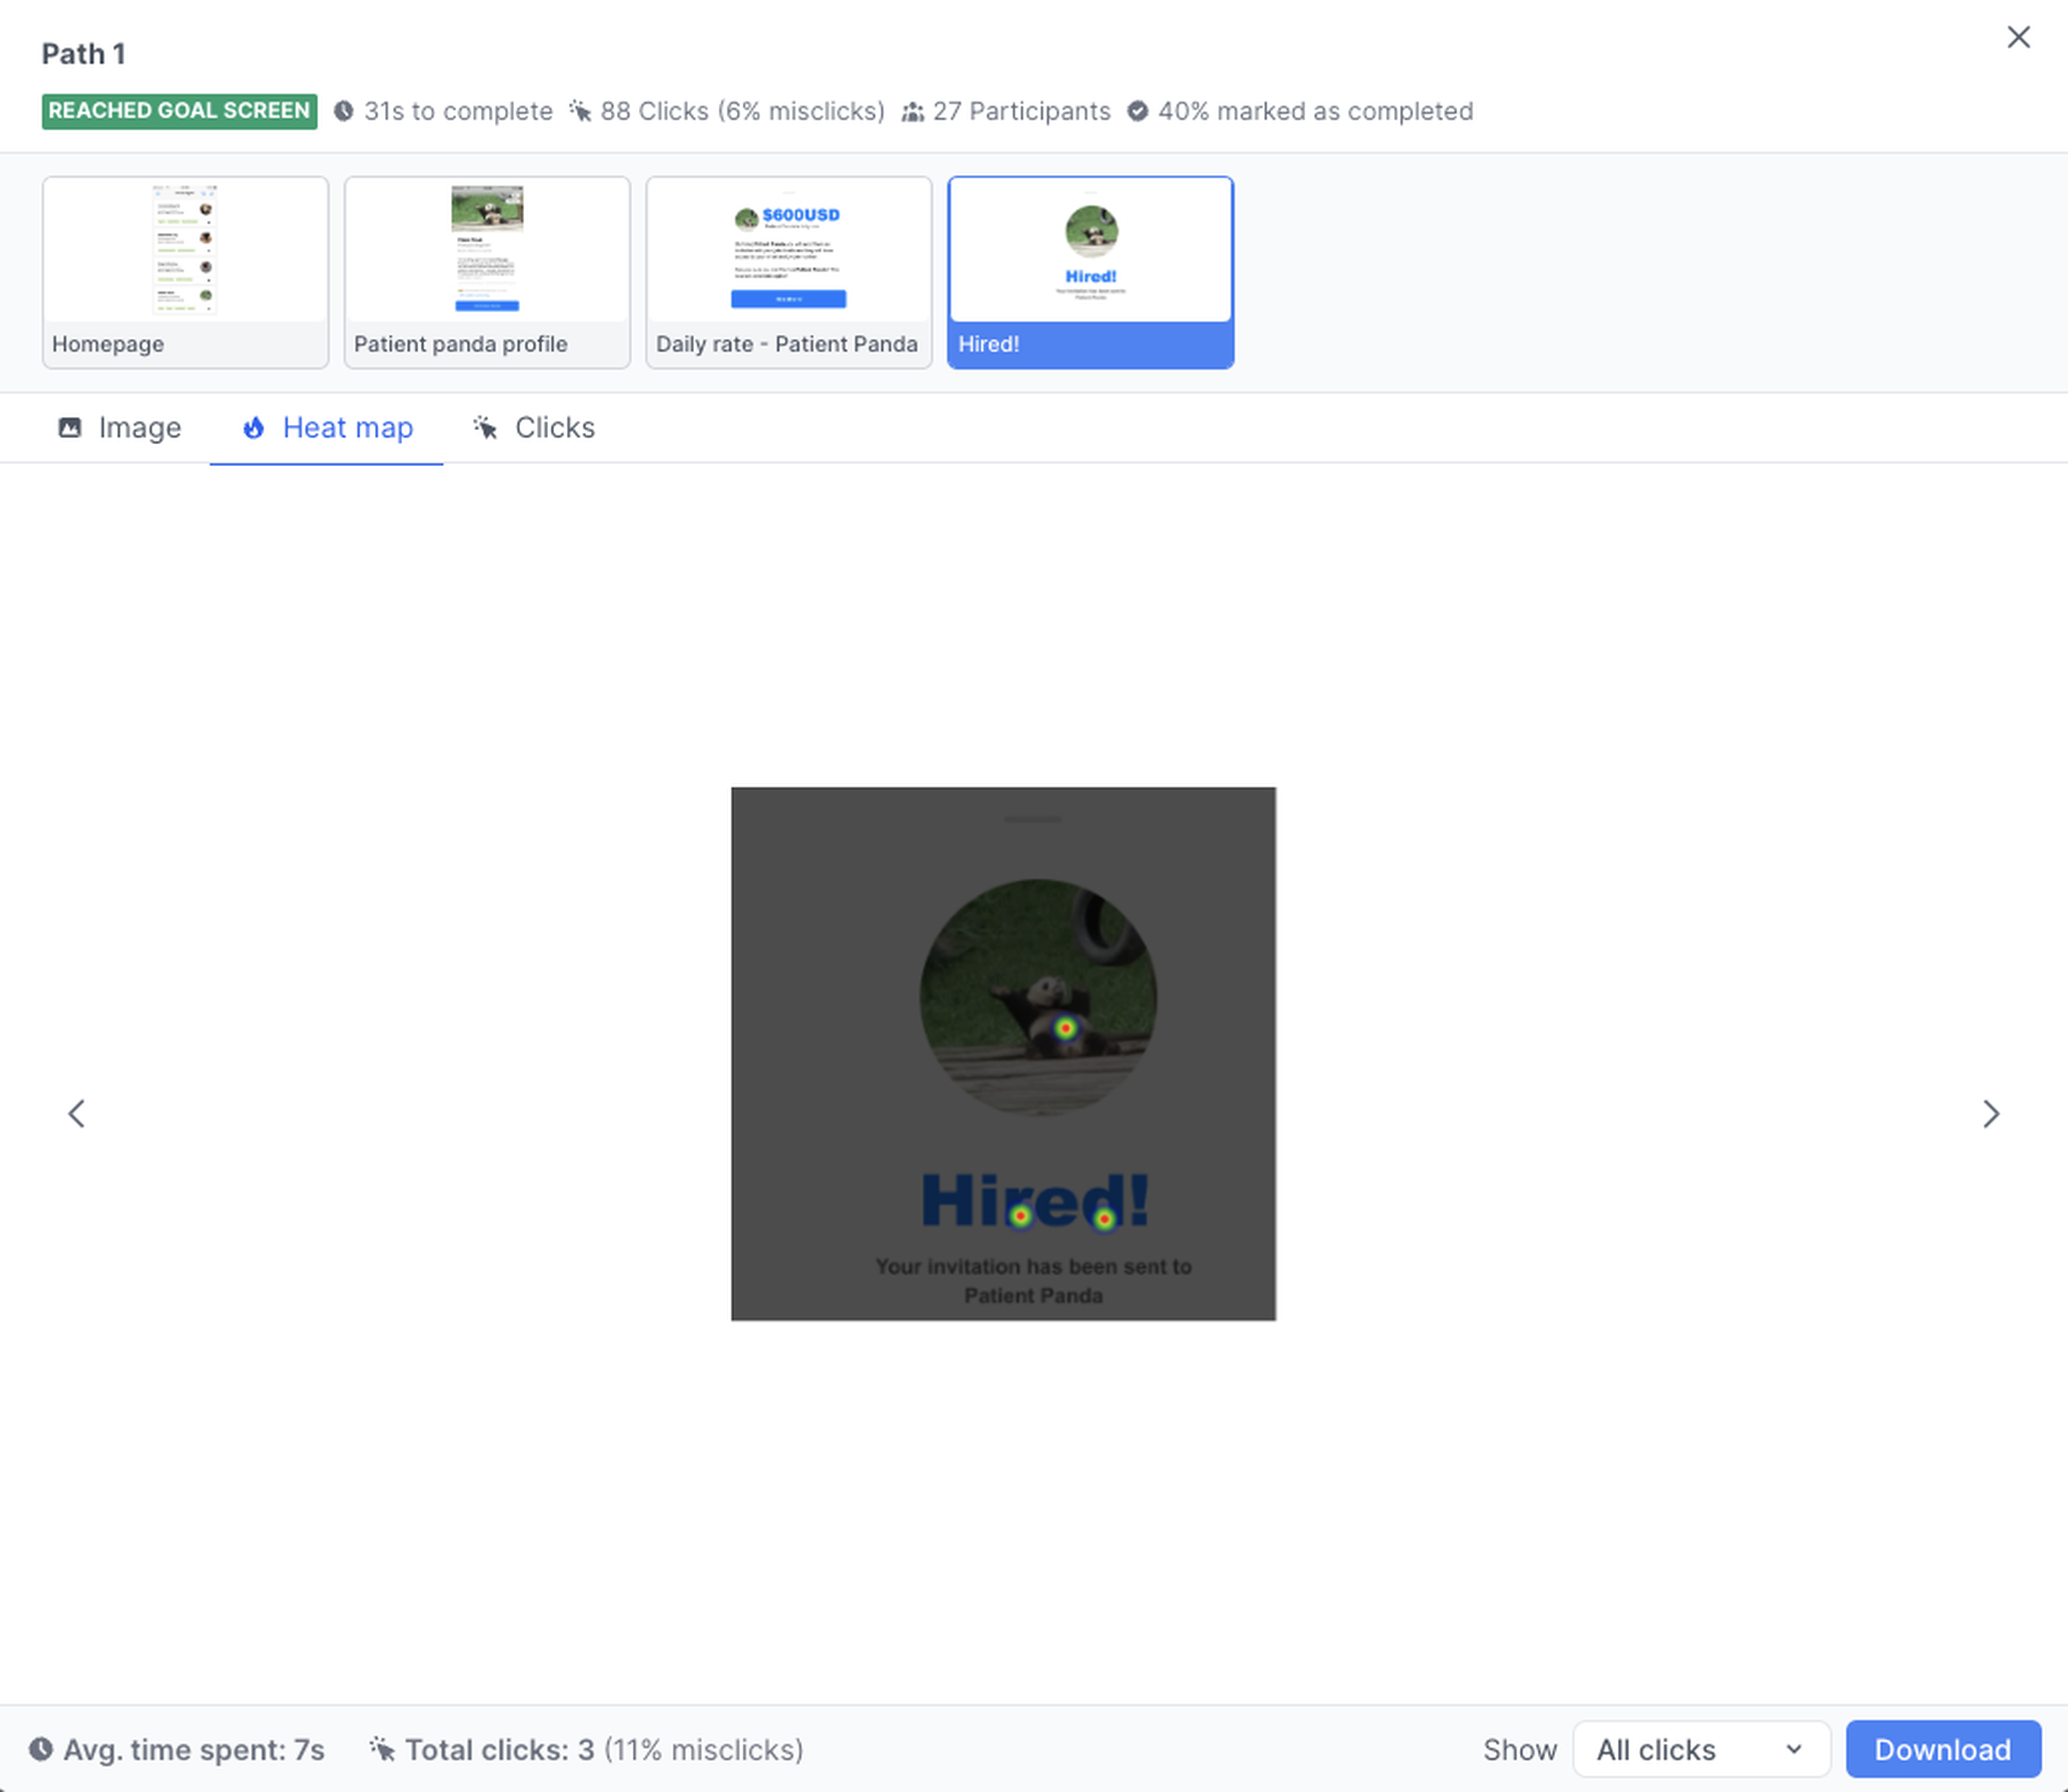
Image modal: Our old image modal showed an enlarged image within a common or individual path, along with the clicks per screen. Our new modal shows:
The image carousel of the path a participant took.
Metrics for each path.
Whether participants reach the goal screen.
Time spent to complete the path.
The number and percentage of misclicks to complete the path.
The ability to click or use left and right arrow keys to view the next image in a path.
The number of participants who took a path (displayed as “Common paths”).
Heat maps tab.
Click maps tab.
Click sequences.
Metrics for each screen.
Average time spent on each screen
Total clicks and percentage of misclicks.
Total clicks and percentage of total clicks.
Sequencing of clicks.
The ability to download click maps and heat maps as images.
The ability to zoom in on images for better accuracy of clicks
Ready to get started with prototype testing?
Phew! Our product team has been hard at work to bring you these prototype test features and updates, and we’re happy to share that everything is now live and ready for you to try.
If you’re looking for specific prototype testing how-to’s, check out our prototype testing guide, our help center articles, or reach out in-app to our awesome support team. You can also check out our template library to get started. Prototype testing is available to customers on all Lyssna plans, including our free plan.
Validate your designs at every stage
Whether you're testing early wireframes or final designs, Lyssna's free plan gives you the flexibility to gather user feedback throughout your design process. Try it now.

You may also like these articles


Sign up to our newsletter
We'll keep you updated with the latest UX insights and more.