05 Apr 2024
|14 min
Analyzing and synthesizing UX research
Learn how to effectively analyze and synthesize qualitative data using thematic analysis and affinity mapping for deeper UX insights.


Analysis and synthesis play crucial roles in making sense of the vast amount of information collected during generative and evaluative user research studies. These processes are like the yin and yang of research. Like Batman and Robin, they’re a dynamic duo that work hand in hand. Together, they transform raw data, also called findings, into valuable learning that can inform decisions, strategies, and actions.
These two processes – analysis and synthesis – are intricately intertwined. While analysis helps you understand the finer details and nuances within your data, synthesis allows you to see the bigger picture, revealing patterns, themes, and connections.
Let’s dive into qualitative analysis and synthesis, including exploring methods like thematic analysis and affinity mapping, to uncover patterns, themes, and connections within your data.
What is analysis in user research?
Analysis is the process of breaking down your notes, artifacts, and observations (aka findings) into smaller, more manageable pieces. I like to call these parts “snippets” of information, as they’re extracted pieces of text or other facets you gather in a study.
Analysis involves examining these data snippets in detail to understand their components, context, and significance. Looking at the extracted pieces is also easier to comprehend than looking at the whole dataset.
For example, I like to think of the analysis process as similar to how I assemble a physical puzzle. First, I take all of the individual pieces out of the box and spread them out. These pieces can be compared to the snippets of data you gather in your studies.
Or to think of it another way, imagine you have a food shopping list with 30 items, including lettuce, tomatoes, cheese, cream, chocolate, flour, wine, paper plates, and cups (among other things). Each item on the list is a snippet of information.
Elevate your research practice
Join over 320,000+ marketers, designers, researchers, and product leaders who use Lyssna to make data-driven decisions.

What is synthesis in user research?
Synthesis is all about combining these snippets to create something new, like a theme. It’s the art of bringing together various elements to form a coherent whole.
In essence, synthesis is the opposite of analysis – it's the process of building up individual parts to gain a holistic perspective. These themes represent a more extensive or fuller representation of the snippets when grouped in several categories.
To build on the puzzle example, after I’ve laid out all the pieces, I sort all the pieces with straight edges into one group. Then I sort the remaining pieces by color (blue, green, red, etc.). Each puzzle piece, or snippet, is now organized into categories (e.g. edges and colors), grouped by relationship or commonality.
Building on the shopping list example, the 30 items on our list can be sorted into categories that mirror sections of a typical supermarket, such as produce, dairy, baking, and party goods. The individual snippets are now categorized into groups with a name that reflects their relationship to the group.
Analysis vs synthesis
In our two examples, you’ll notice the first step (analysis) focuses on the components separately. It allows you to zero in on the subtle details and intricacies present in your data.
The second step, synthesis, results in identifying several themes. It provides a broader perspective, uncovering patterns and links.
The processes of analysis and synthesis are interdependent yet function collaboratively:
Analysis and synthesis occur multiple times for a comprehensive dataset.
For full data comprehension, alternate between analysis and synthesis.
Iterating through analysis and synthesis enhances understanding.
Each cycle of analysis and synthesis deepens your familiarity with the dataset.
Applying analysis and synthesis in succession broadens your knowledge and scope.
While it’s important to separate data into snippets and to group it into themes and categories, it’s equally as important to note what may be missing. Consider what wasn't said or observed. Going back to our shopping list, there’s no meat or seafood listed, for example. We can learn equally as much from information that isn’t included!
Collecting data for analysis and synthesis
Before we dive deeper into analysis and synthesis methods, let's talk about how researchers collect data. There are primarily two methods: listening and observing.
When we listen, we aim to uncover the why behind people's actions and decisions. It helps us understand their motivations, beliefs, values, and the underlying reasons for their behaviors.
Observation focuses on the how. It involves watching people's habits, behaviors, and actions to gain insights into their actions and choices.
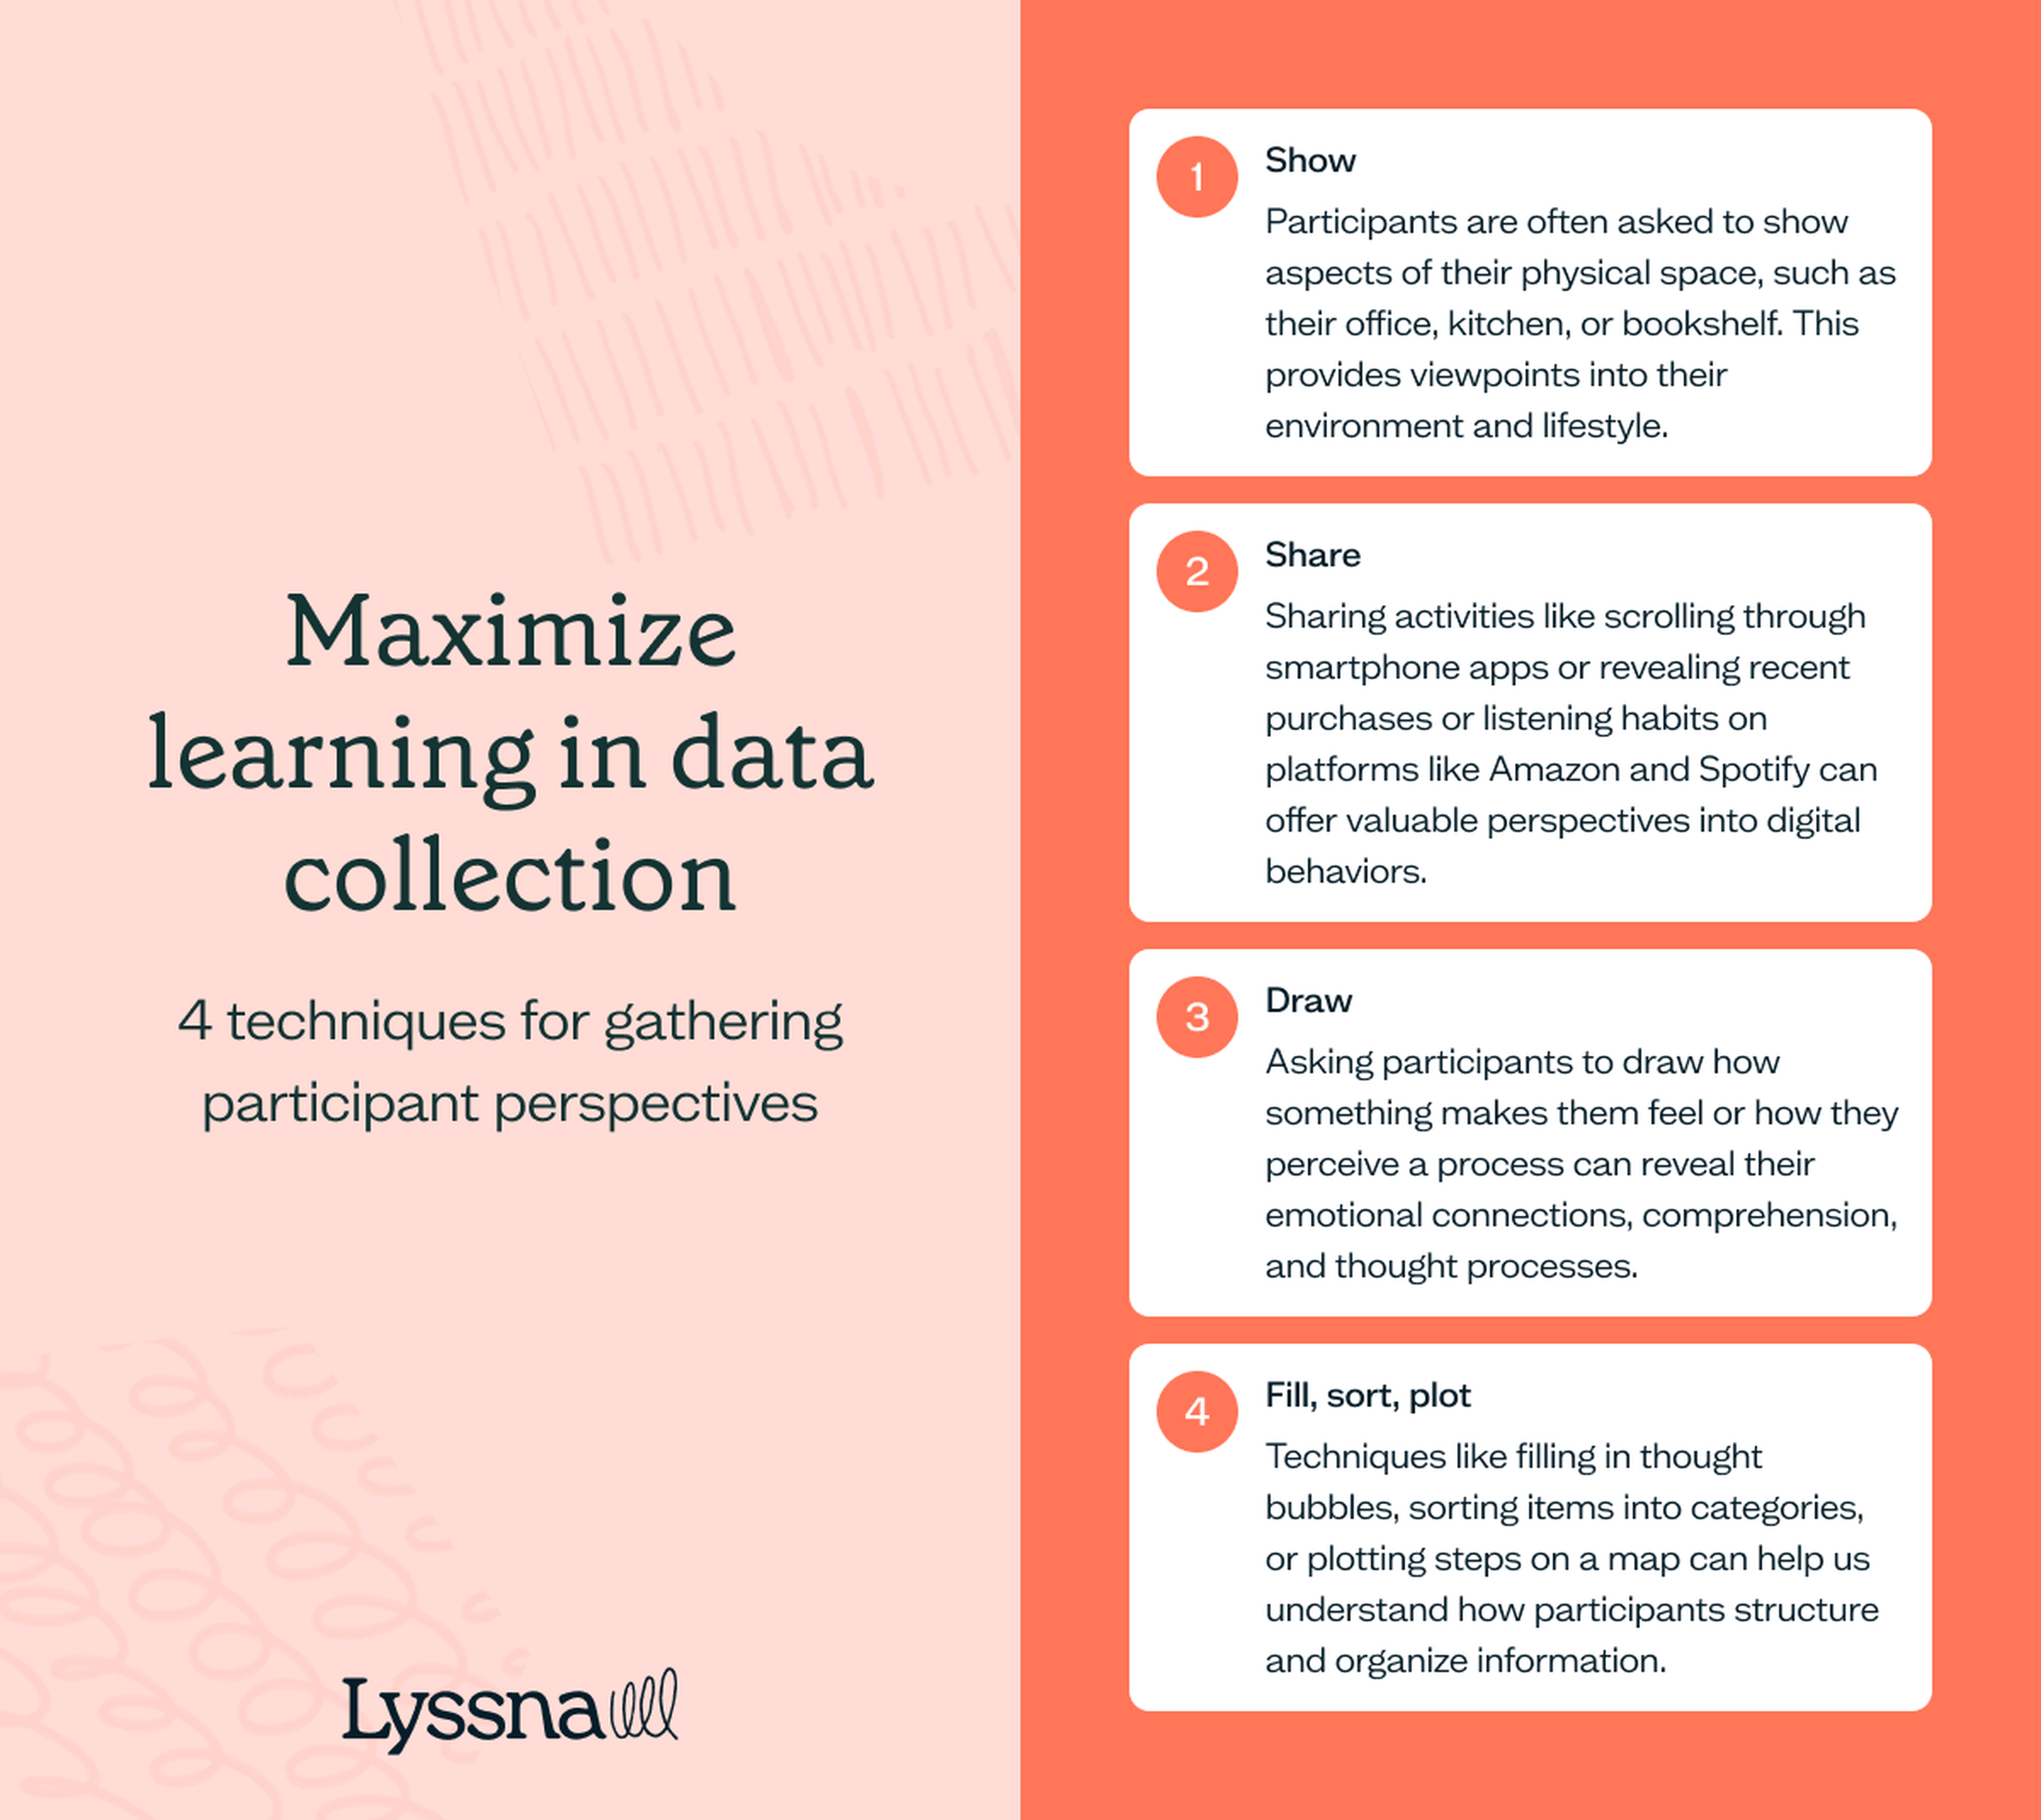
To maximize learning during the data collection phase, researchers use various techniques to gather participants' perspectives. These include:
Show: Participants are often asked to show aspects of their physical space, such as their office, kitchen, or bookshelf. This provides viewpoints into their environment and lifestyle.
Share: Sharing activities like scrolling through smartphone apps or revealing recent purchases or listening habits on platforms like Amazon and Spotify can offer valuable perspectives into digital behaviors.
Draw: Asking participants to draw how something makes them feel or how they perceive a process can reveal their emotional connections, comprehension, and thought processes.
Fill, sort, plot: Techniques like filling in thought bubbles, sorting items into categories, or plotting steps on a map can help us understand how participants structure and organize information.
Data collection methods can be extremely creative and fun to design, and they provide a rich and varied dataset for analysis and synthesis.
These techniques also yield terrific visual artifacts that can enhance your research reports. They can also save valuable time in note-taking, as participants create the documentation themselves!
Note-taking strategies for analysis and synthesis
Effective note-taking is a critical aspect of qualitative analysis and synthesis. Researchers use various note-taking strategies to make sure they capture essential details during interviews, observations, and other interactions. These strategies are closely linked to the later stages of analysis and synthesis.
Note-taking isn't about finding immediate solutions; it's about letting insights emerge from the data. Frameworks provide structure and guide researchers in organizing their data and, ultimately, identifying actionable insights.
Success in analysis and synthesis begins with a well-defined note-taking strategy. Here are some best practices to consider:
Choose your data analysis method before the research sessions begin, whether it's thematic analysis with digital spreadsheets, visual affinity maps, or other means.
Inform your team about the chosen frameworks and strategies you’ll employ to provide alignment. It’s essential the team is taking notes consistently!
Schedule dedicated time for analysis and synthesis on your stakeholder(s) calendars before the synthesis process starts.
Gather all collected data and make it visible for easy access and reference.
Establish a shared vocabulary to ensure clear communication.
Identifying patterns in user research data
Humans are pattern-recognition machines! Our brains are wired to identify and make sense of patterns in the data we encounter. This innate ability is super valuable in qualitative analysis and synthesis. Research plans guide us to seek patterns that help us achieve our research goals. Recognizing and transforming patterns into actionable steps is a crucial aspect of these processes.
In the same dataset, different people will identify a variety of patterns based on their unique perspective. This is why collaborative analysis and synthesis (e.g. gathering feedback from your stakeholders) is paramount. Aligning on research goals helps us focus on specific patterns most relevant to the study.
Synthesis plays a pivotal role in identifying meaning within these patterns. By analyzing data through various lenses (e.g. with a diverse team and multiple frameworks), you can uncover more profound understanding.
If you don’t have collaborative or available stakeholders, consider how different personas might interpret the data to incorporate multiple perspectives. In one of the workshops I run, we do an activity where participants are asked to identify patterns in a series of images, then identify patterns from their mother’s perspective, then a child’s perspective. It’s remarkably effective. Try it!
Thematic analysis
Thematic analysis is a widely-used qualitative research method that helps researchers make sense of seemingly disparate qualitative data. It's a literal approach that involves several key steps:
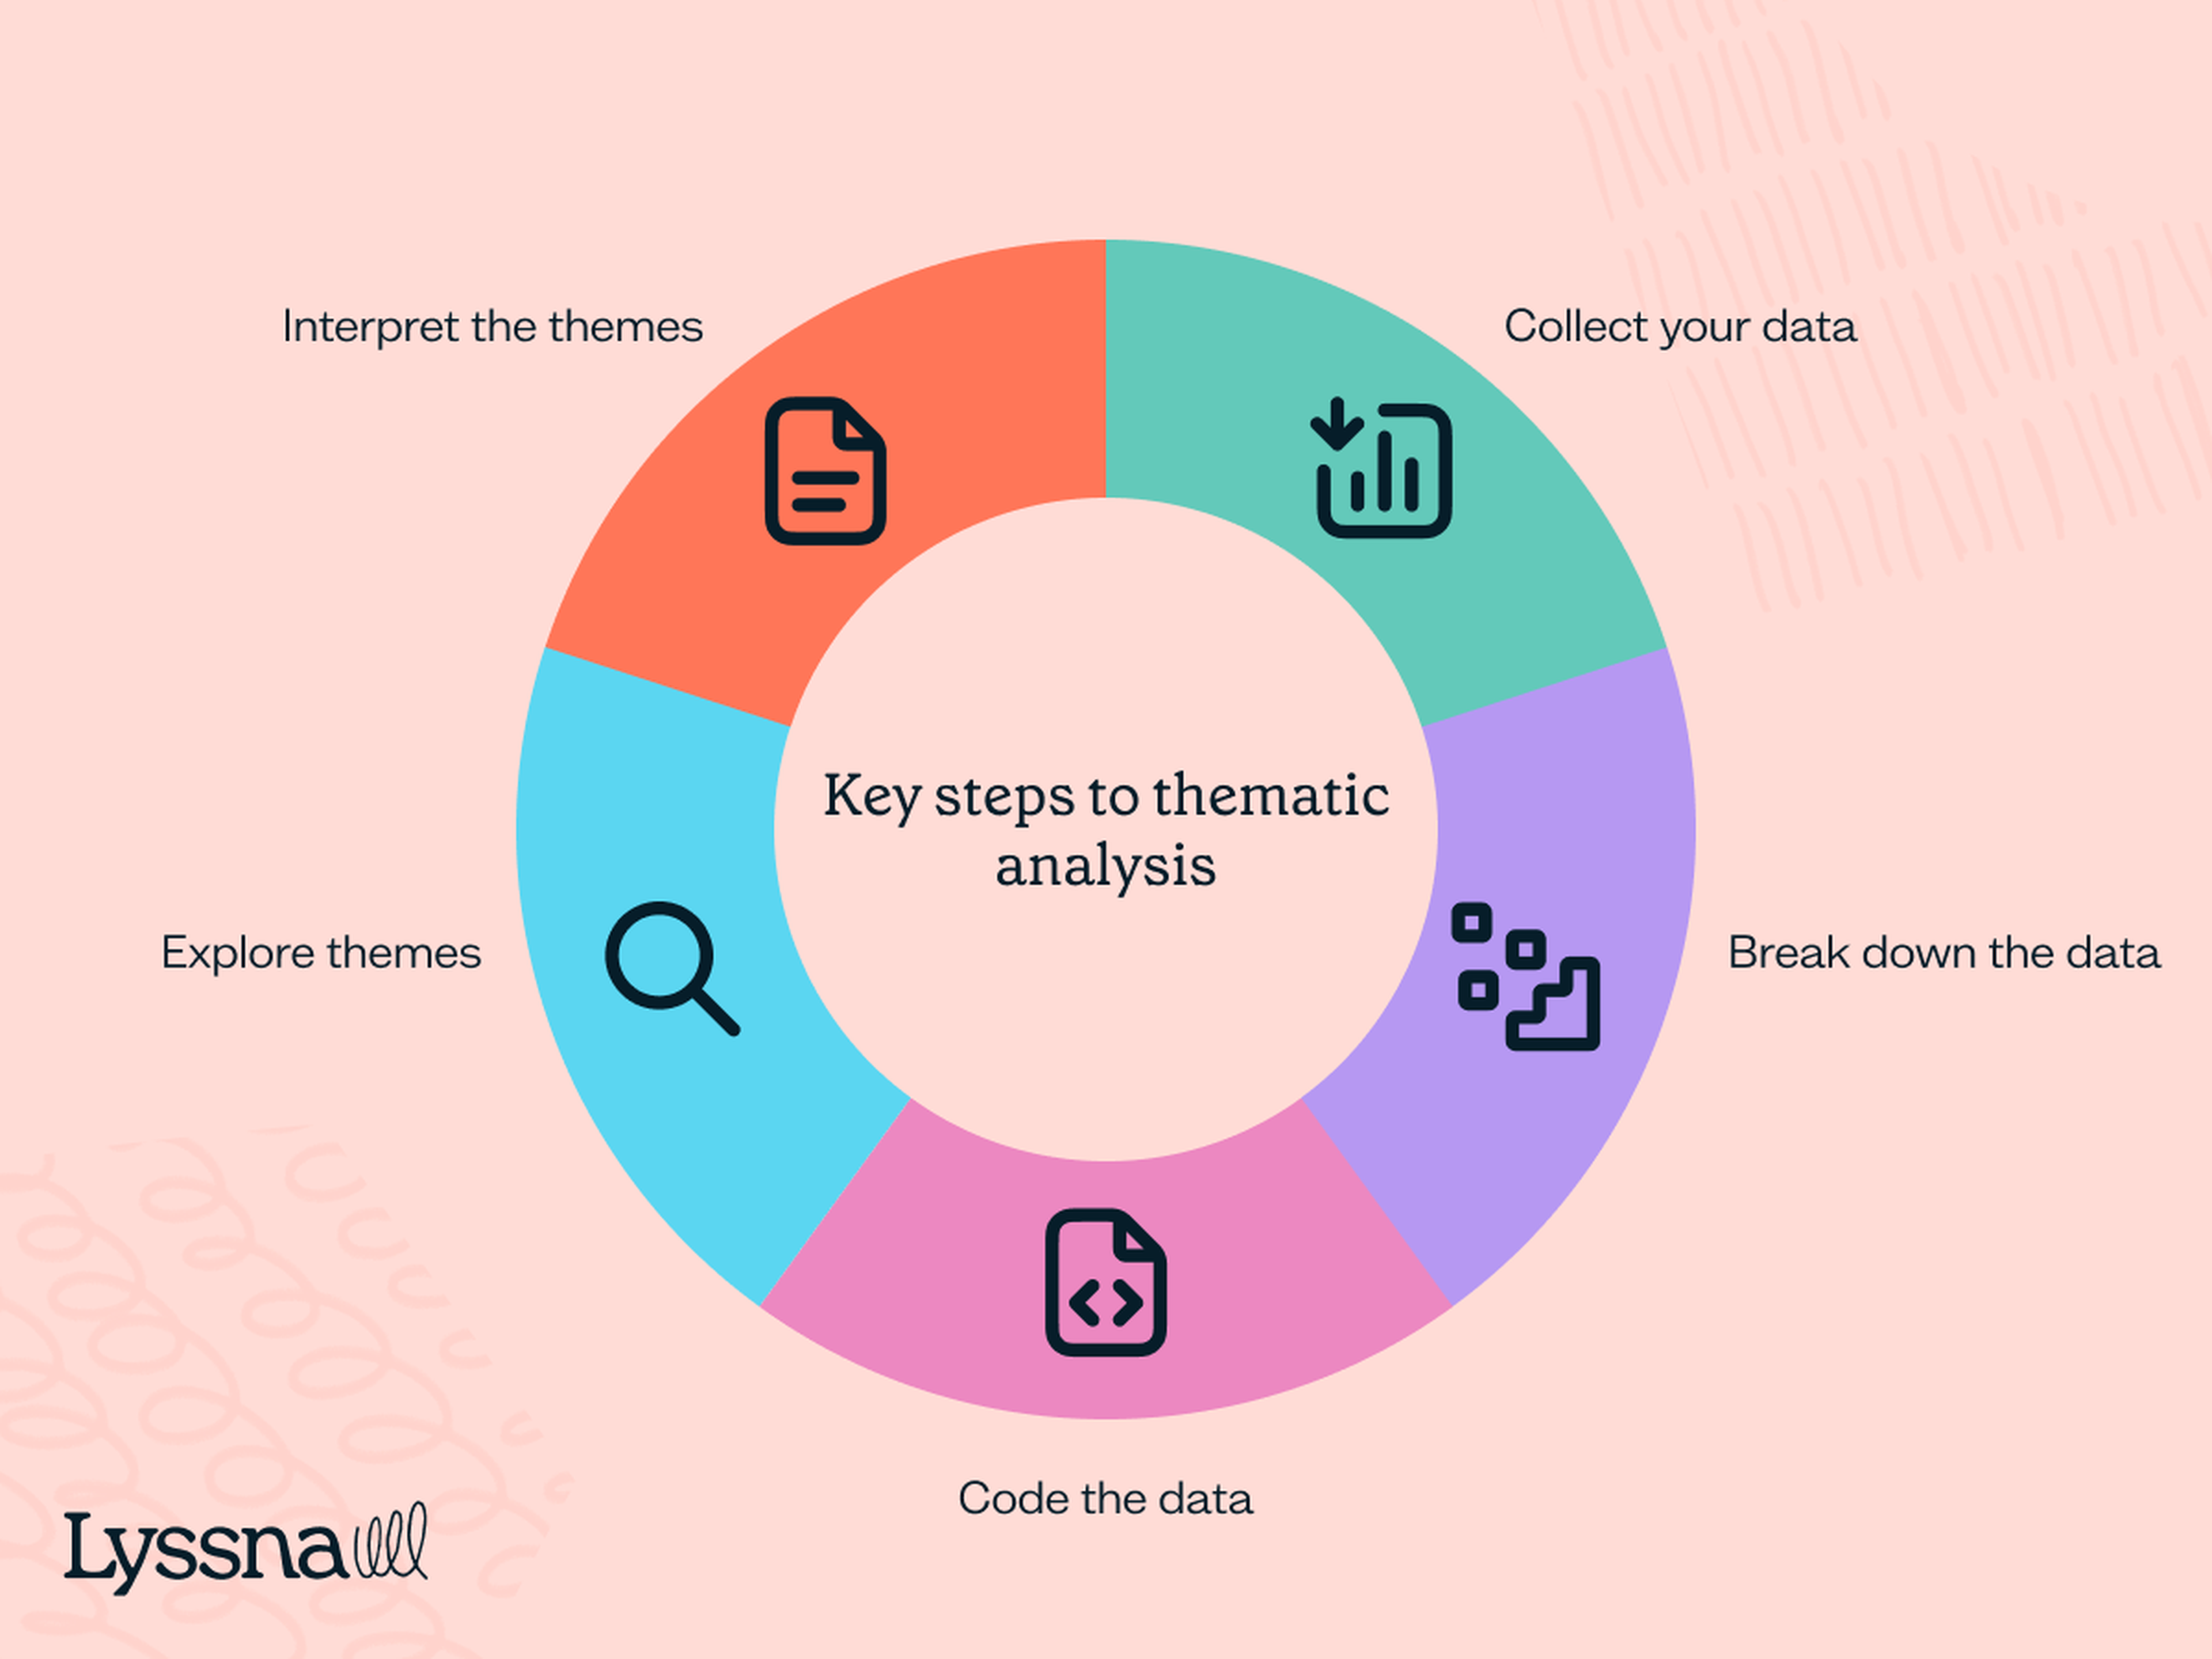
Collect your data: Gather your qualitative data from interviews, participatory design, diary studies, ethnographies, survey responses, etc.
Break down the data: Systematically break down the data collected into smaller, manageable “snippets” (e.g. segment the data into individual pieces to make it easier to analyze specific elements and nuances).
Code the data: Begin coding the individual snippets by categorizing or tagging each one with a relevant name that represents its core concept or theme. In other words, what unifies them.
Explore themes: Explore the relationships and similarities between the coded snippets to uncover patterns. Analyze the coded data to identify and develop overarching themes and understand the broader dataset narrative. Zoom in and out to explore data from different perspectives.
Interpret the themes: Identify and analyze the themes to answer your research questions and find meaningful insights within larger data sets.
Not every data snippet will fit neatly into an overarching theme, and that's okay. Any outliers can be categorized under a theme name like "miscellaneous" or "other." As you apply other frameworks and perspectives to your data, these outliers will likely find homes, and new data snippets may become outliers.
Thematic analysis provides a systematic and thorough examination of your data, helping to mitigate bias and provide a clear structure for analysis and synthesis. It’s also known for its flexibility, making it adaptable to various research contexts and data types.
I love this quote from qualitative researchers Virginia Braun and Victoria Clarke:
"Analysis involves a constant moving back and forward between the entire data set, the coded extracts of data that you are analyzing, and the analysis of the data that you are producing."
Affinity mapping
Affinity mapping is a visual form of thematic analysis, used extensively in qualitative UXR. This method stands out by transforming data snippets into visual elements, such as sticky notes or digital cards, facilitating a more interactive and collaborative approach to data analysis.
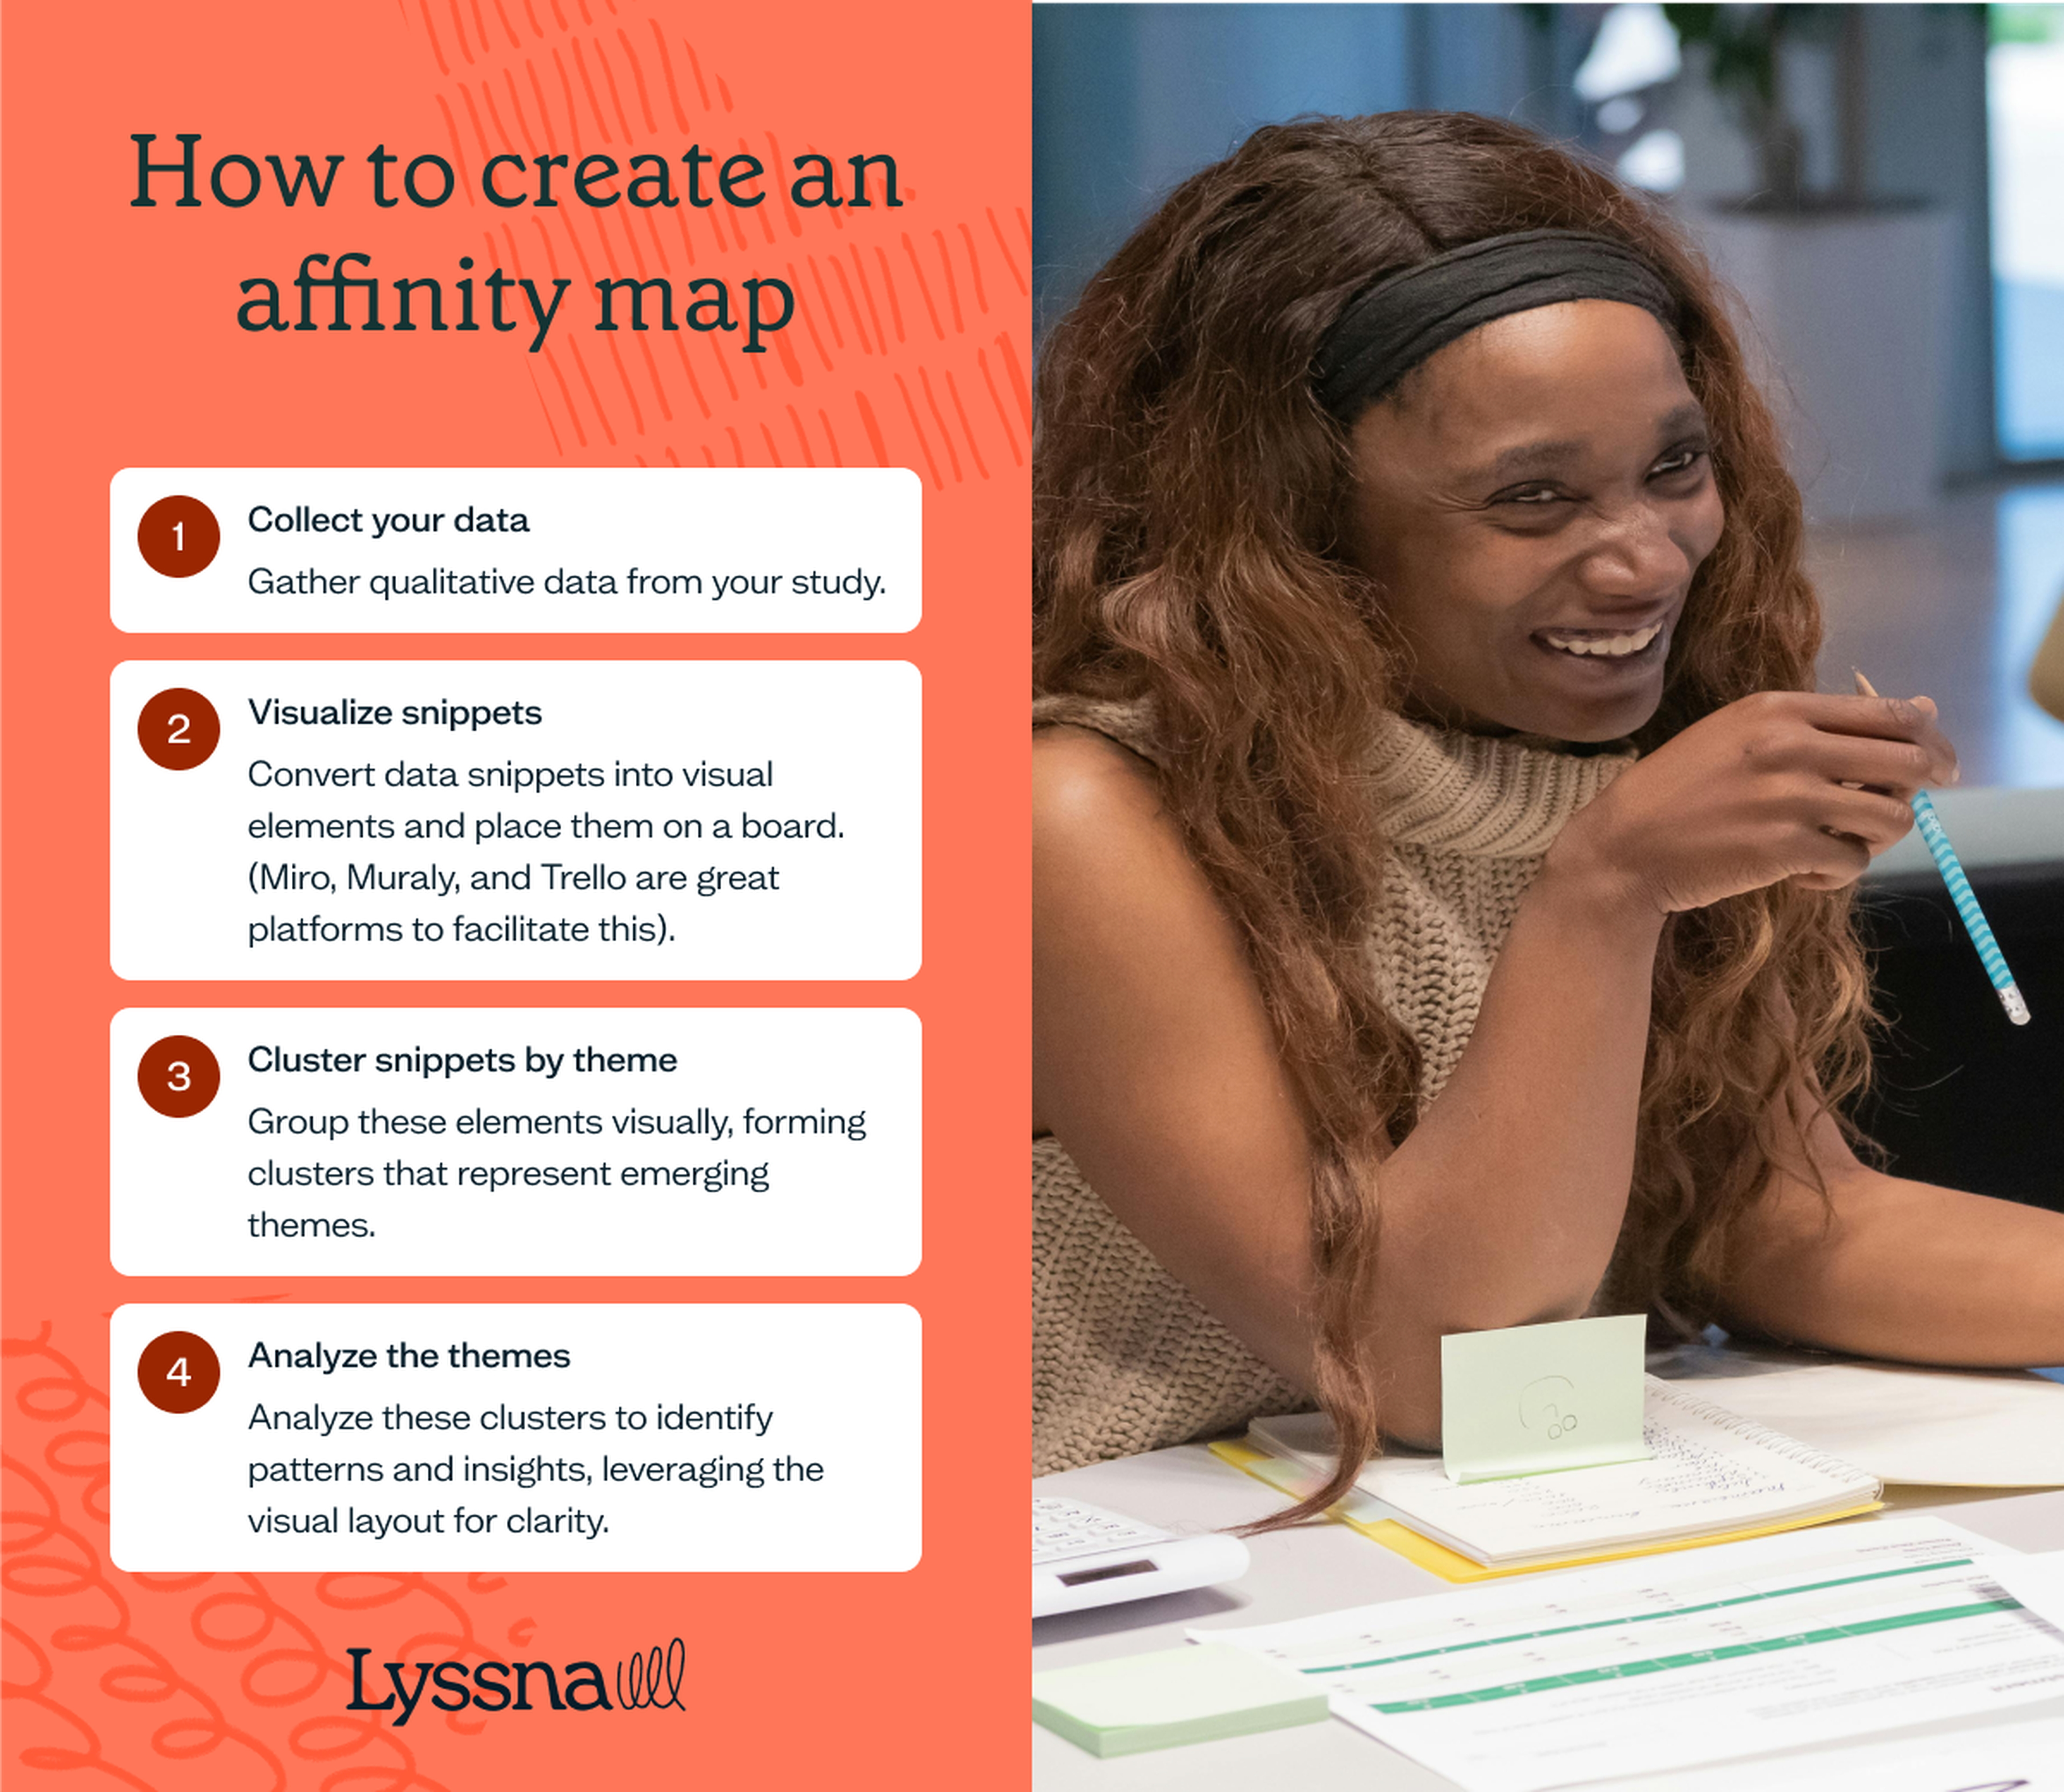
Here’s a high-level overview of how to create an affinity map:
Collect your data: Gather qualitative data from your study.
Visualize snippets: Convert data snippets into visual elements and place them on a board (Miro, Muraly, and Trello are great platforms to facilitate this).
Cluster snippets by theme: Group these elements visually, forming clusters that represent emerging themes. This grouping may be created by changing the colors of the sticky notes or digital cards, moving the sticky notes or digital cards around, or drawing lines or shapes around clusters of snippets within each theme.
Analyze the themes: Analyze these clusters to identify patterns and insights, leveraging the visual layout for clarity.
You can duplicate your datasets each time you change frameworks or perspectives so you don’t lose progress. For example, if your first framework or cluster is about pros and cons, and the second framework focuses on commonalities and differences, you’ll want to duplicate the first dataset to preserve it before starting on another round. I made the rookie mistake of not duping my data once, and boy oh boy, that was a hard lesson to learn!
Combining frameworks with affinity mapping
To take your analysis a step further, you can combine frameworks with affinity maps. A 2x2 framework, for example, allows data to be sorted along two opposing characteristics, providing a deeper understanding of relationships. To do this:
Plot a single theme along the X-axis, for example, “low to high priority.”
Choose an opposing framework along the Y-axis, for example, “low to high frequency.”
Plot the data according to where it falls within the 2x2 framework’s quadrants.
The 2x2 frameworks I've found to be extremely useful in my own research include impact vs. feasibility, opportunity vs. effort, cost vs. timeline, frequency of use vs. satisfaction, and importance vs. urgency.
Overall, 2x2 frameworks help make sure that the results yield meaningful and actionable insights for product decisions. Collaborating with your team may be essential to compile a realistic 2x2 framework, especially if you’re plotting data according to cost, dev time, or resource allocation. Your PM and dev stakeholders will likely appreciate you consulting with them on these aspects as well.
Your go-to user research platform
The best teams use Lyssna so they can deeply understand their audience and move in the right direction — faster.

Additional analysis and synthesis methods
While thematic analysis and affinity mapping are popular methodologies, there are several other versatile techniques.
Here’s a quick summary of common approaches:
Mindmapping (qualitative): Creates visual representations of ideas and concepts to explore relationships and hierarchies, focusing on qualitative aspects of data.
Search-log analysis (quantitate with qualitative elements): This technique primarily focuses on quantitative analysis of user search queries, emphasizing metrics like the frequency of specific search terms, search sequences, and click-through rates. It can encompass qualitative elements such as understanding the intent behind queries or interpreting the contextual meaning of search patterns.
Red light, green light (qualitative/quantitative): Identifies critical issues (red lights) and opportunities (green lights), which can be qualitative in understanding issues or quantitative in measuring frequency or severity.
Content analysis (qualitative/quantitative): Systematically categorizes and codes text data, often used qualitatively for interpreting patterns and trends, but can also be applied in a quantitative manner.
Each of these methods offers unique approaches to data analysis, and there are many more.
The method you choose should be informed by your research question, the nature of your data, and your desired outcome.
--
This article was authored by Michele Ronsen, Founder and CEO of Curiosity Tank. Michele is a user research executive, coach and educator. She teaches design and user research to people around the world. Her corporate trainings and workshops are inspired by working with Fortune 500s and start-ups for more than twenty years. Fuel Your Curiosity is her award winning, free, user-research newsletter. In 2020, LinkedIn honored Michele with a TopVoices award in the Technology category. She is the first and only researcher to receive this award.
You may also like these articles


Try for free today
Join over 320,000+ marketers, designers, researchers, and product leaders who use Lyssna to make data-driven decisions.
No credit card required